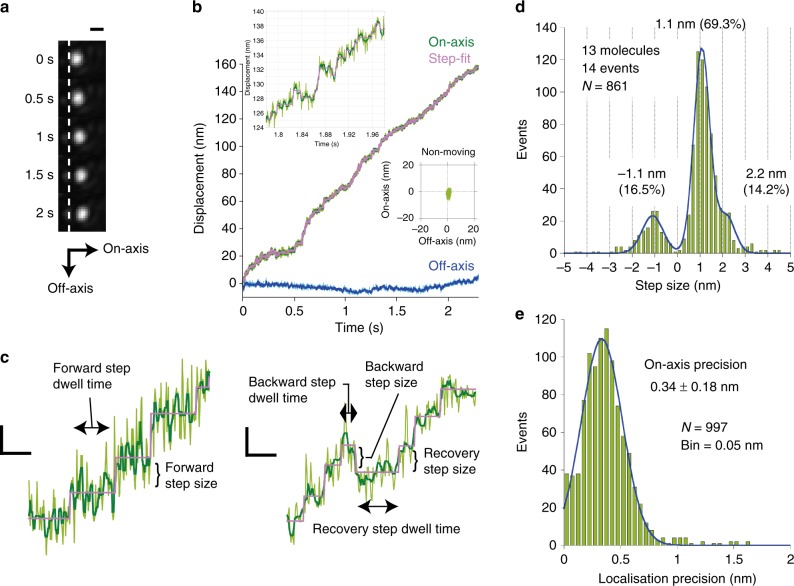
Fig. 2.
Stepping movement of SmChiA probed by 40-nm AuNP. a Example of image sequence. Scale bar is 400 nm. b Trajectory of SmChiA movement shown in a. Raw trajectory: light green; median-filtered (current ± 2 ms): dark green. Magenta line: steps and pauses fitted to median-filtered trajectory. Two-dimensional trajectory of non-moving molecule in the same field of view is also shown, in the same scale. c Examples of expanded trace. Forward, backward, and recovery step sizes and dwell times before these steps are indicated. Scale bars on vertical and horizonal axes are 1 nm and 30 ms, respectively. d Forward and backward-step size distribution. The peak values of Gaussian fittings (blue line) are shown. Step ratios were estimated from Gaussian areas. e On-axis localisation precision during pauses. The value is peak ± SD of Gaussian fitting (blue line)

