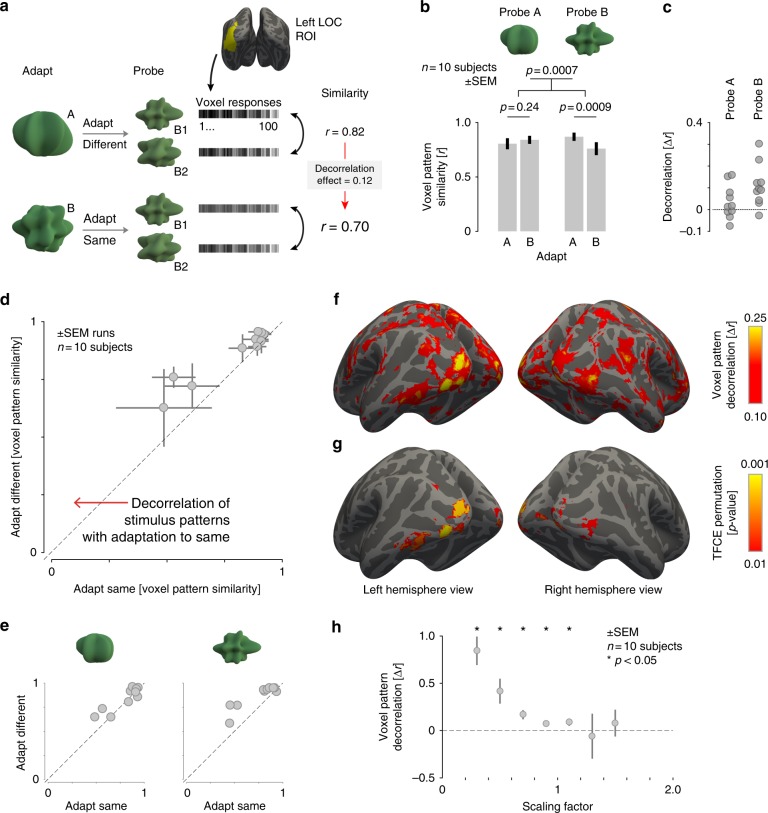
Fig. 3.
Voxel pattern discriminability. a Schematic of the fMRI decorrelation analysis. We measured responses in left LO to a pair of probe shapes after adaptation to either shape class A or B. We then computed the similarity of voxel responses evoked by the pairs of probe shapes, and compared the resulting Pearson’s correlation for the probe shapes that were either adapted or unadapted. A decorrelation effect was defined as the difference between these two correlation values. The logic of the analysis is illustrated for the test in which shape class B served as the probe. b Voxel pattern similarity for probe stimuli from the A (left) and B (right) shape classes. Patterns were more distinct (less correlated) for probe shape pairs after undergoing adaptation to the same shape class. Error bars are standard error of the mean across subjects (n = 10). p-values are shown for paired t-tests. c Magnitude of the decorrelation effect for individual subjects. d Correlation between multi-voxel patterns for each subject, comparing the condition in which probe stimuli were from the same space as the adaptors (x-axis), to when they were from the different space (y-axis). For every subject, patterns from adapted pairs of stimuli were less correlated than patterns from unadapted stimuli. Each data point represents one subject and error bars represent variability (SEM) across scan acquisitions within subject. e Correlation between multi-voxel patterns for each subject displayed separately for each probe. f A whole-brain searchlight analysis presenting the mean, across-subject magnitude of the decorrelation effect across the cortex, thresholded at Δr > 0.10. g A whole-brain decorrelation significance map obtained from a permutation test with threshold-free cluster enhancement, thresholded at p < 0.01. h Voxel pattern decorrelation measured separately for groups of voxels with varying degrees of response suppression. The scaling factor of each voxel was measured as the ratio between mean response in the adapted condition vs. mean response in the unadapted condition. Error bars represent variability (SEM) across subjects and asterisks denote significant (p < 0.05) decorrelation assessed with a paired t-test

