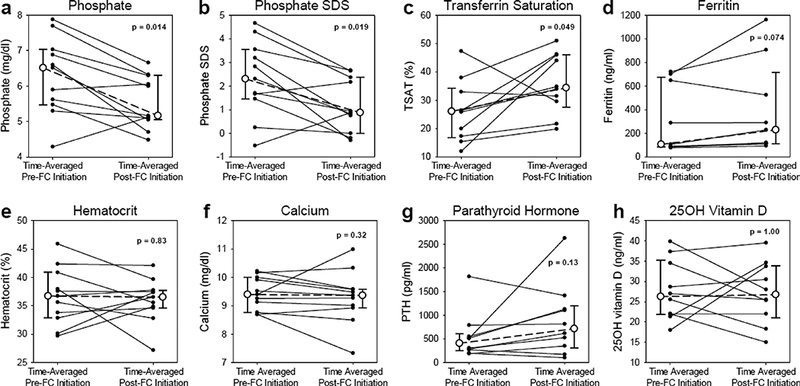
Figure 1: Changes in serum parameters pre-ferric citrate initiation and post-ferric citrate initiation.

Serum parameters shown are (a) phosphate, (b) age-adjusted phosphate standard deviation score (SDS), (c) transferrin saturation (TSAT), (d) ferritin, (e) hematocrit, (f) calcium, (g) parathyroid hormone (PTH), and (h) 25OH vitamin D. With ferric citrate (FC) treatment, phosphate decreased, phosphate SDS decreased, TSAT increased, ferritin tended to increase, and hematocrit, calcium, PTH, and 25OH vitamin D did not significantly change. For each patient, the time-averaged parameter values before and after FC are indicated by the small, closed circles. For each parameter, the median time-averaged values before and after FC are indicated by large, open circles; the error bars represent the interquartile range (IQR), with the lower error bar indi cating the 25th percentile, and the upper error bar indicating the 75th percentile. The Wilcoxon signed-rank test was used to compare the median values before and after FC initiation. For phosphate, phosphate SDS, hematocrit, and calcium, n=11 patients; for TSAT, PTH, and 25OH vitamin D, n=10 patients; and for ferritin, n=9 patients
