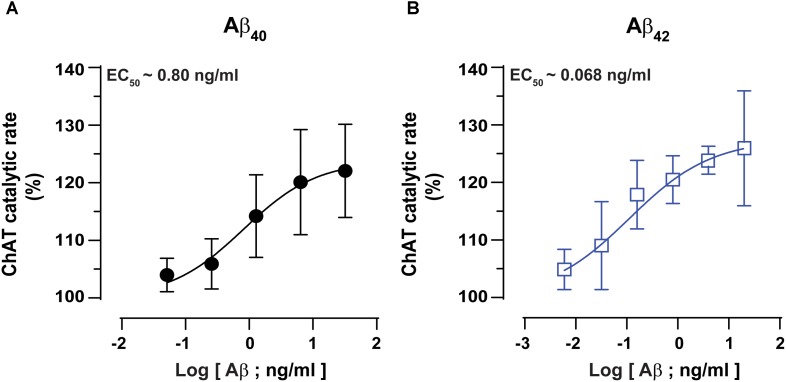
FIGURE 3.
ChAT enzyme kinetic analyses for the estimation of half-maximal effective (EC50) concentration of Aβ40 and Aβ42. The curves in (A,B) represent the percent changes in the rate of ChAT (ΔRFU/h) at different Aβ40 and Aβ42 concentrations, ranging from 0 to 32 ng/mL and 0 to 20 ng/mL, respectively. The activity of control sample (ChAT with no Aβ) was considered as 100%. The EC50 values were calculated after fitting the curves using non-linear regression analysis in GraphPad Prism 7. The values are shown as mean ± SD of ≥3 independent experiments.

