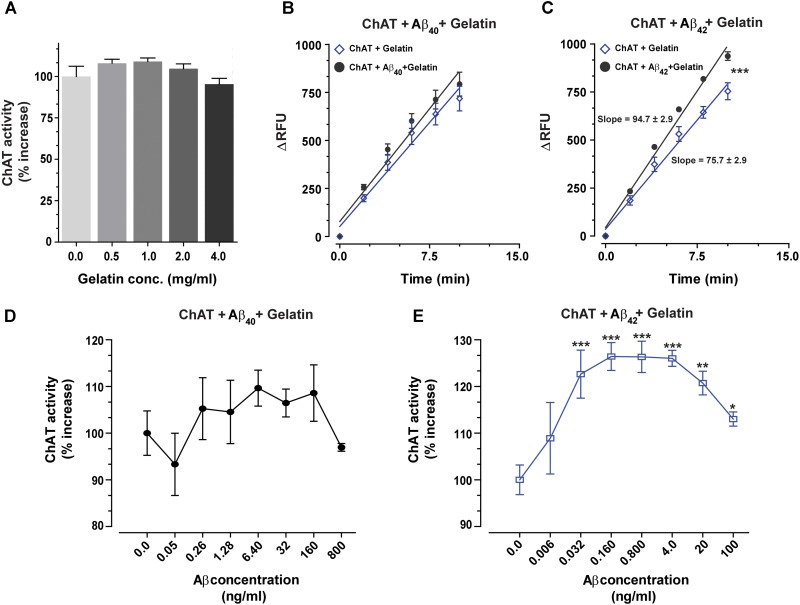
FIGURE 4.
The enhanced catalytic rate of ChAT by Aβ42 is specific. (A) To demonstrate that Aβ-enhanced ChAT activity is a specific phenomenon, ChAT activity was first monitored at various concentrations of gelatin, ranging from 0 to 4 mg/mL. The result indicated that gelatin had no significant effect on ChAT activity. The values are shown as mean ± SD of four readings. (B) The kinetic rate of ChAT activity (ΔRFU/min) was measured in the presence of gelatin alone (1 mg/mL) as a control and gelatin+Aβ40 (6.4 ng/mL). Although analyses of the slopes were not statistically significant, the comparison of the elevations or intercepts was significant (F = 9.2, p < 0.004). (C) Then the kinetic rate of ChAT activity (ΔRFU/min) is shown in the presence of gelatin alone (control) and gelatin+Aβ42 (0.16 ng/mL). In this case, the differences in the slopes were statistically highly significant (F = 21, ∗∗∗p < 0.0001). The analyses of the slopes were done by using linear regression function in GraphPad Prism 7. The values are shown as mean ± SD of ≥2 readings. (D) Illustrates the percent changes in the ChAT activity in presence of gelatin (1 mg/mL) plus increasing concentrations of Aβ40. (E) Shows the corresponding percent changes in the ChAT activity in presence of gelatin (1 mg/mL) plus increasing concentrations of Aβ42. The symbols ∗, ∗∗, and ∗∗∗ represents p-values <0.03, <0.001, and <0.0005, respectively, relative to the control (no Aβ). The comparisons are based on one-way ANOVA analysis and Fisher’s LSD post hoc test.

