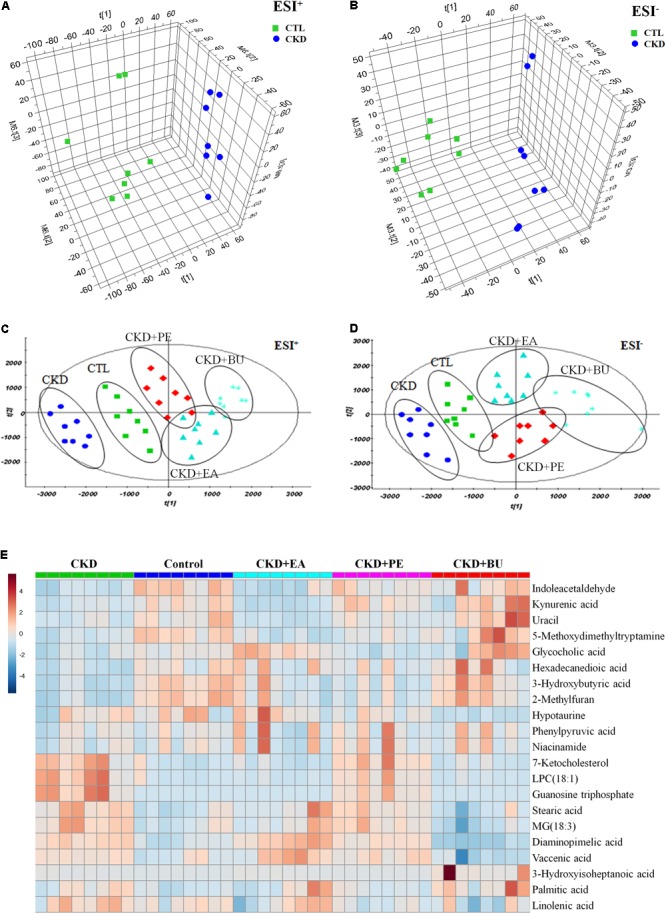
FIGURE 3.

Metabolomic profiling of tissue samples. (A) PCA scores plot from CKD samples and control samples in positive ion mode. (B) PCA scores plot from CKD samples and control samples in negative ion mode. (C) PCA scores plot of comparing control, CKD, CKD+PE, CKD+EA, and CKD+BU groups in positive ion mode. (D) PCA scores plot of comparing control, CKD, CKD+PE, CKD+EA, and CKD+BU groups in positive ion mode. (E) Heat maps for 21 altered metabolites. Red and blue indicate increased and decreased levels, respectively. Rows, metabolites; columns, tissue samples.
