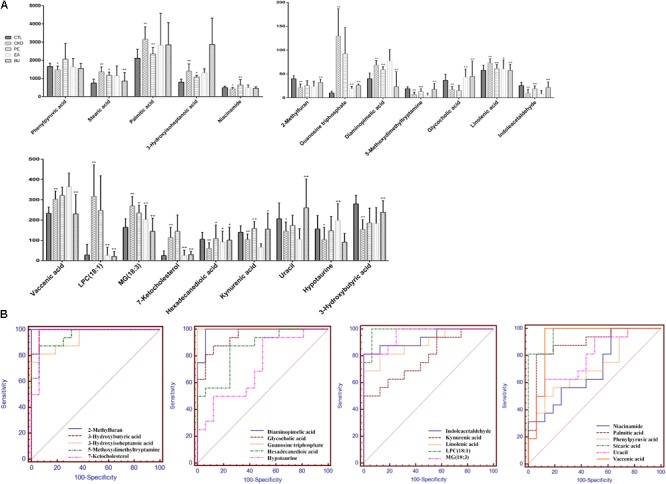
FIGURE 5.

Relative concentrations of the 21 metabolites in control, CKD, CKD+PE, CKD+EA, and CKD+BU groups (A) and their receiver operating characteristic curves (B). ∗p < 0.05, ∗∗p < 0.01 compared to control group; +p < 0.05, ++p < 0.01 compared to CKD group.
