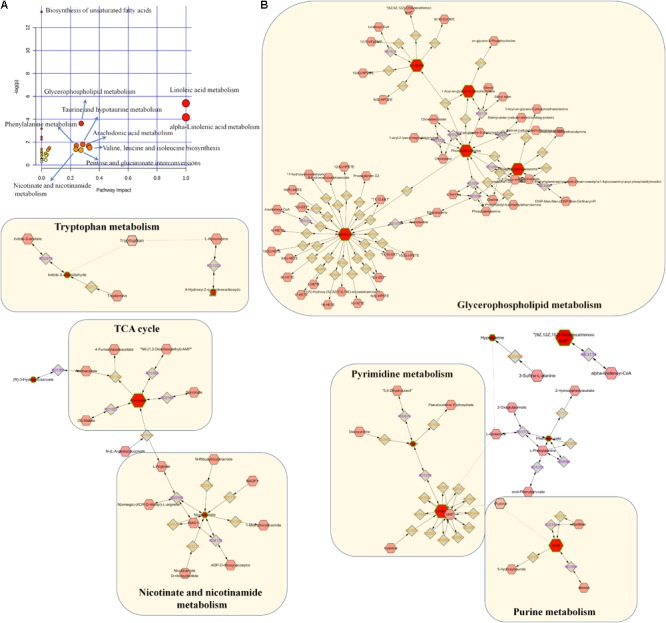
FIGURE 6.

Pathway analysis of the differential metabolites. (A) Pathway analysis of 40 differential metabolites. The size and color of each circle was based on pathway impact value and p-value, respectively. (B) Metabolic pathways were visualized by means of cytoscape software. The differential metabolites in our study were represented by red hexagons. Hexagons with green lines mean that the alteration of the biomarkers in CKD had statistical significance. The size of hexagons indicated the FC of the corresponding metabolite in CKD in relative to controls. In addition, pink hexagons indicated metabolites participating in the metabolic pathway but not been detected in our study. Diamonds mean that the metabolites convert to the products by the reactions.
