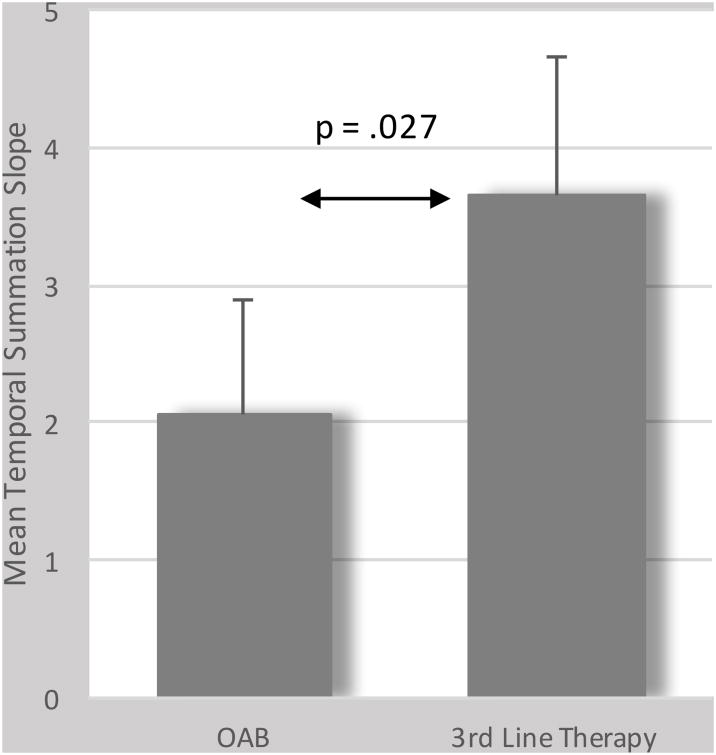
Figure 1.
Comparison of means of temporal summation slopes between women with OAB undergoing and not undergoing 3rd line therapy. Bar represents the mean, adjusted for age, OAB symptom severity, and initial VAS pain scores during the temporal summation protocol while the stem represents the standard deviation.

