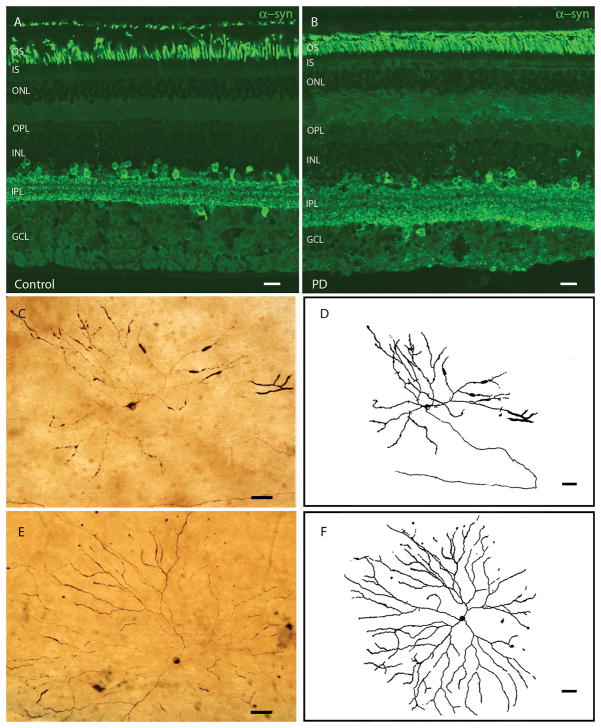
Fig. 1. Immunohistochemical staining pattern of α-syn and p-syn.
A–B: α-syn staining (green) of a control (left) and a PD (right) retinal transversal cut. No differences in immunostaining pattern or intensity are found between controls and PD. C–F: Ganglion cells from PD retinas accumulating p-syn. D and F are drawings of C and E, respectively, made with camera lucida. Control retinas did not have any stained p-syn structures or cells (data not shown). Scale bars A–B= 20 μm; C–F=50 μm.

