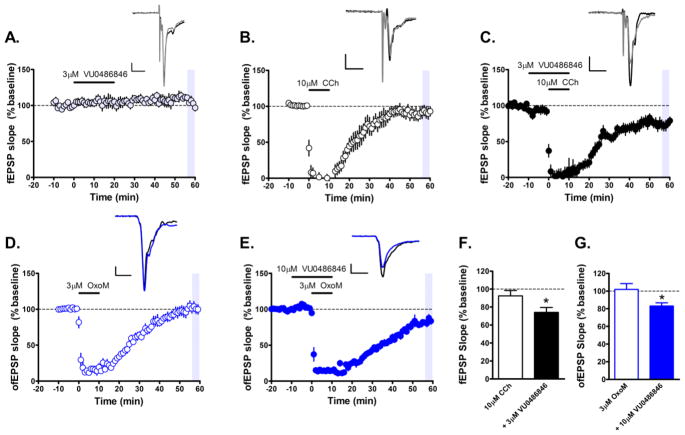
Figure 5.
M1 PAM VU0486846 can robustly potentiate a submaximal cholinergic agonist-induced long-term depression (LTD) in layer V of the prelimbic mPFC evoked by either electrical or optical stimulation. (A) Time course graph showing that bath application of 3 μM VU0486846 for 20 min led to no significant change in fEPSP slope. (B) Time course graph showing that bath application of 10 μM carbachol (CCh), a cholinergic agonist, induces a negligible LTD of fEPSPs in layer V electrically evoked by stimulation of layer II/III in the mPFC. (C) 10 min pretreatment of the M1 PAM VU0486846 (3 μM) followed by a 10 min coapplication of PAM and 10 μM CCh led to a robust LTD of electrically evoked fEPSP slope. Inset shows representative fEPSP traces for each condition for baseline (black trace) and 50 min after CCh washout (gray trace). (D) Time course graph showing that bath application of 3 μM OxoM, a selective muscarinic agonist, for 10 min led to an acute depression followed by a minimal LTD of optically evoked fEPSPs (ofEPSP) measured 46–50 min following drug washout. (E) Under similar conditions, bath application 10 min pretreatment of the M1 PAM VU0486846 (10 μM) followed by a 10 min coapplication of PAM with 3 μM OxoM led to a robust LTD of ofEPSP slope. Inset shows representative ofEPSP traces for each condition for baseline (black trace) and 50 min after OxoM washout (blue trace). (F) Quantification of fEPSP slope 46–50 min following drug washout (shaded area) indicates a significant depression of fEPSP slope with 3 μM VU0486846 + 10 μM CCh compared to 10 μM CCh alone (n = 9 brain slice experiments per group). (G) Quantification of ofEPSP slope 46–50 min following drug washout (shaded area) indicates a significant depression of ofEPSP with 10 μM VU0486846 + 3 μM OxoM compared to 3 μM OxoM alone (n = 6–8 brain slice experiments per group). Scale bars denote 0.5 mV and 5 ms. Data are expressed as mean ± SEM; *p < 0.05, Student’s t test.

