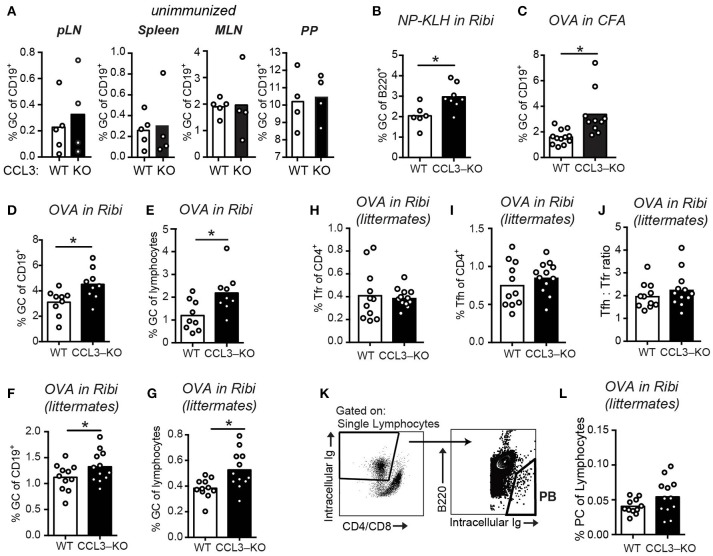
Figure 3.
Increased GC response in CCL3-KO mice following immunization. (A–G) Flow cytometry analysis of the GC B cells (Fashigh GL7high IgDlow) as a fraction of total B cells (A–D,F) or total lymphocytes (E,G) in WT and CCL3-KO mice. (A) Analysis of GCs in pLNs (inguinal, brachial and auxillary LNs combined), spleens, MLNs, and PP from unimmunized mice. (B–G) Analysis of GCs in the dLNs from mice s.c. immunized with 50 μg of 4-Hydroxy-3-nitrophenyl (NP) acetyl-hapten conjugated to Keyhole limpet hemocyanin (KLH) in Ribi adjuvant (B) or 50 μg of OVA in Complete Freund's Adjuvant (CFA) (C) or 50 μg OVA in Ribi (D–G) at 10 d.p.i. (F–L) Flow cytometry analysis of GC (F,G) Follicular T cell (H–J), and plasma cell (PC) (K,L) response in dLNs of WT and CCL3-KO littermate conrol mice s.c. immunized with 50 μg OVA in Ribi at 10 d.p.i. (H–J) Tfr (CXCR5high PD1high FoxP3pos in H) and Tfh (CXCR5high PD1high FoxP3neg in I) cells as a fraction of CD4 T cells. (K,L) PB gating strategy (K) and PBs as a fraction of total lymphocytes (L). Each symbol represents one mouse. Bars represent mean. Data are derived from 2 or 3 independent experiments. *P < 0.05, Student's t-test (two-sided in B–E, one-sided in F,G).

