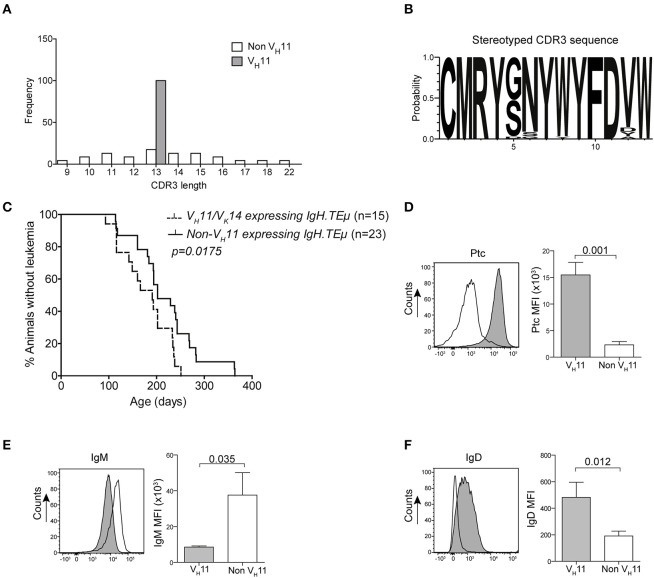
Figure 1.
Early onset of disease in VH11 expressing CLL from IgH.TEμ mice. (A) Bar graphs summarizing the distribution of CDR3 length in VH11 (gray, n = 15) vs. non-VH11 (white, n = 23) CLL from IgH.TEμ mice. (B) Web logo depicting stereotyped CDR3 amino acid sequence of VH11 (n = 15) CLL from IgH.TEμ mice. (C) Retrospective Kaplan-Meier incidence curves including IgH.TEμ mice with identified VH11 (dotted line) or non-VH11 BCR CLL (solid line). (D–F) Histogram showing flow cytometric analysis of CD19+CD5+CD43+ splenic CLL cells from VH11 (gray) vs. non-VH11 (black line) CLL from IgH.TEμ mice, stained with (D) phosphatidylcholine (PtC) liposomes or fluorochrome conjugated (E) anti-IgM or (F) anti-IgD antibodies. Bar graphs summarize mean fluorescence intensity of VH11 (gray) and non-VH11 CLL (n = 6 per group).

