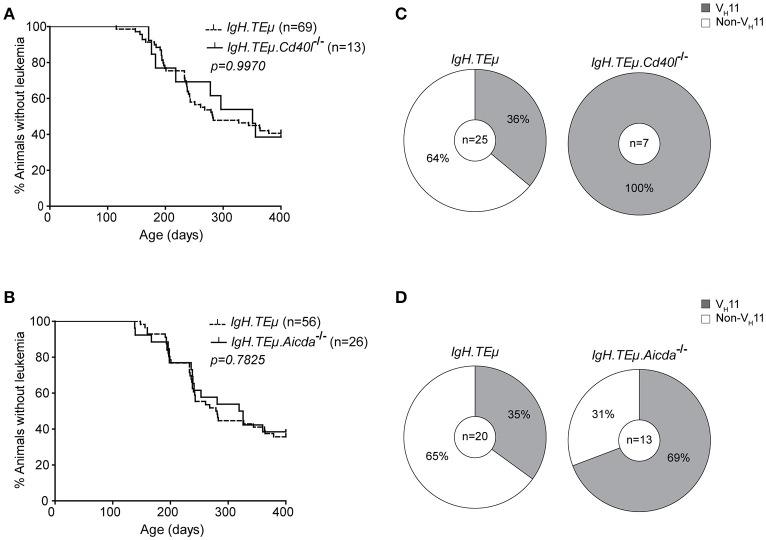
Figure 2.
Increased frequency of VH11 usage in CLL from germinal center attenuated IgH.TEμ mice. (A,B) Kaplan-Meier incidence curves of (A) IgH.TEμ (dotted line) vs. IgH.TEμ.Cd40l−/− (solid line) mice or (B) IgH.TEμ (dotted line) vs. IgH.TEμ.Aicda−/− (solid line) mice. (C,D) Pie charts summarizing frequencies of VH11 BCR (gray) and non- VH11 BCR-expressing CLL in the indicated mouse groups.

