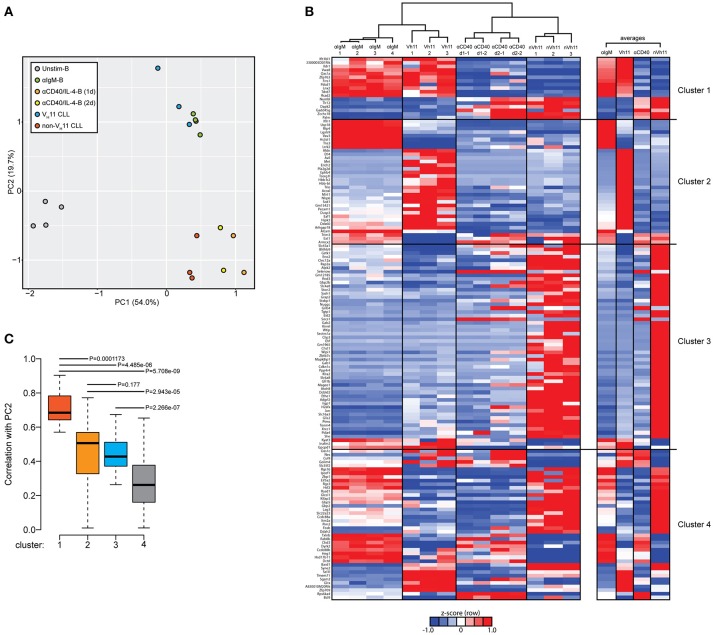
Figure 6.
Genes discriminating VH11 from non-VH11 CLL show similarly distinct expression profiles in BCR or CD40-stimulated B-cells. (A) Principle component analysis (PCA) using the 148 differentially expressed genes defined in Figure 5A in unstimulated (n = 4, black), anti-IgM-stimulated (n = 4, green) WT splenic B cells, 1 day (n = 2, orange) or 2 day (n = 2, yellow) anti-CD40 plus IL-4 stimulated follicular B-cells (obtained from GSE77744), VH11-2+/Vk14-126+ BCR (n = 3, blue) and non-VH11 (n = 3, red) BCR-expressing CLL from IgH.TEμ mice. (B) Hierarchical clustering analysis (top) and accompanying heat map showing differences in expression levels (RPKM, shown as row Z-scores) of the 148 gene signature in anti-IgM-stimulated (n = 4) WT splenic B cells, 1 day (n = 2) or 2 day (n = 2) anti-CD40 plus IL-4 stimulated follicular B-cells, VH11 and non-VH11 CLL from IgH.TEμ mice. Heatmap shown on the right shows average expression levels for each group. (C) Boxplot showing average correlation values of each of the four gene clusters shown in B with principal component 2 (PC2) from the PCA shown in A. P-values were calculated using a Mann-Whitney U-test.

