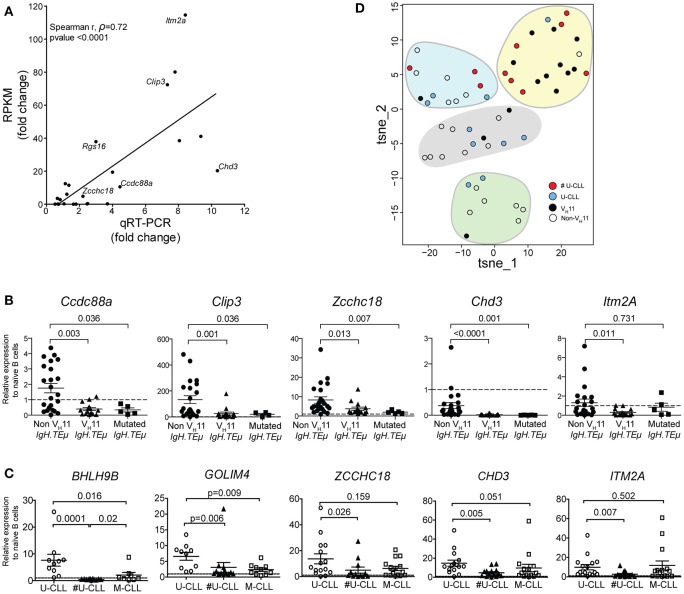
Figure 7.
qRT-PCR validation of a subset of differentially expressed genes. (A) Correlation plot comparing fold-changes in expression between VH11 and non-VH11 CLL for 24 genes measured by RNA-Seq (RPKM) or qRT-PCR (spearman r, ρ = 0.72; p < 0.0001). The differentially expressed genes selected for further study are indicated. Characteristics of samples tested in qRT-PCR are provided in the Methods section (B) Expression of indicated genes as measured by qRT-PCR in VH11 (n = 15), non-VH11 (n = 23) and mutated (n = 5) CLL from IgH.TEμ mice. (C) Expression of indicated genes as measured by qRT-PCR in CLL cells from non-stereotypic U-CLL (n = 15), stereotypic U-CLL (#U-CLL, n = 14) and M-CLL (n = 15) patients. Bars in (B,C) represent mean ± SEM values. The expression values were calculated relative to expression in (B) naïve splenic WT B cells from mice (n = 4) or (C) naïve circulating B cells from healthy controls (n = 3), both of which were set to 1 (dashed line). Numbers indicate p-values (Mann-Whitney U-test). (D) t-SNE clustering analysis of the expression values for 13 signature genes (from Supplementary Table 7) using dCT values obtained by qRT-PCR for non-sterotypic (#U-CLL, n = 10) and stereotypic (U-CLL, n = 10) human U-CLL and non-VH11 (n = 21) and VH11 (n = 14) CLL from IgH.TEμ mice, as indicated. Expression values were converted to Z-scores separately for mouse and human datasets to allow combined t-SNE analysis.

