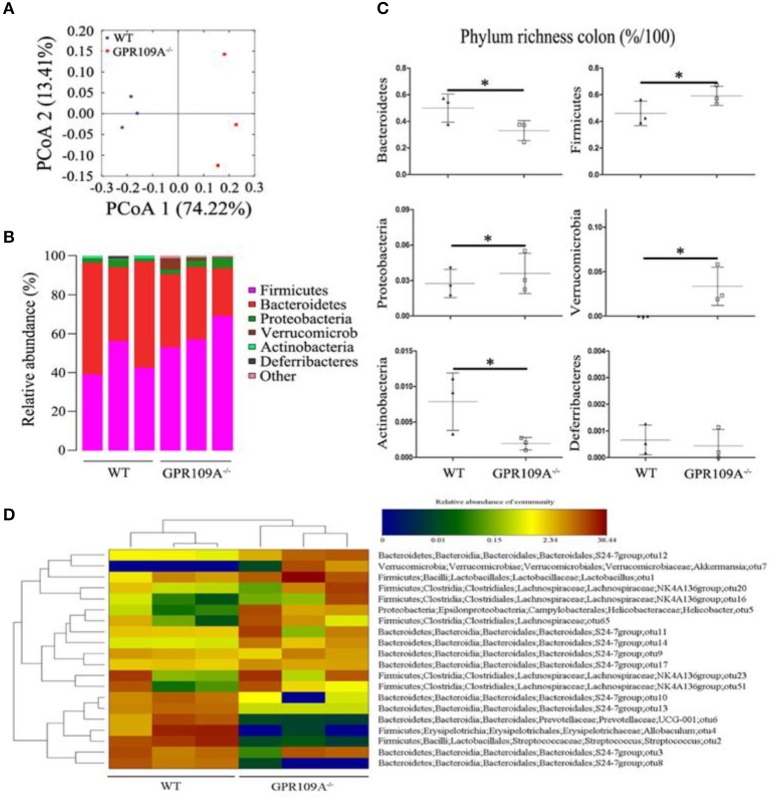
Figure 3.
GPR109A regulates the gut microbiota of mice. (A) Principal coordinates analysis (PCoA) based on unweighted UniFrac distances of OTUs. Each symbol represents a single WT or Gpr109a−/− colon sample (n = 3 for both). (B) Comparison of phylum-level proportional OTU abundances in WT or Gpr109a−/− colon samples (n = 3 for both). (C) Representative proportions of OTUs classified at the phylum level (n = 3 mice for each). *p < 0.05. (D) Heatmap depicting the OTU abundances at the phylum level within the Bacteroidetes, Firmicutes, Proteobacteria, and Verrucomicrobia. OTUs are shown as Phylum, Class, Order, Family, Genus, and Species.

