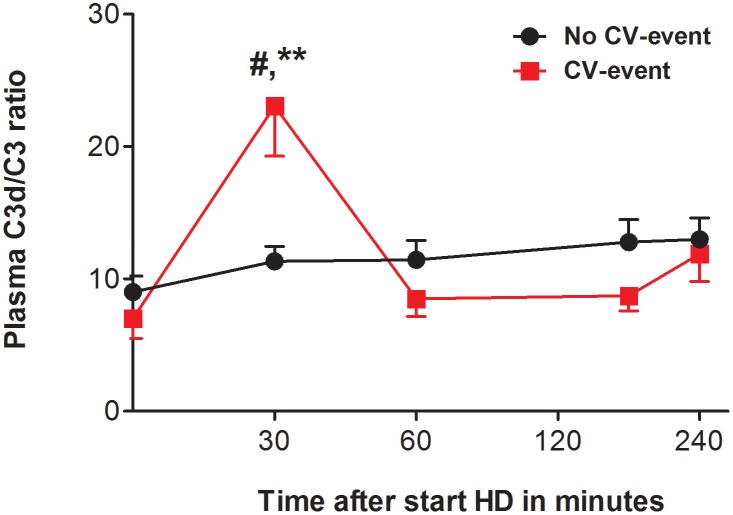
Figure 1.
The C3d/C3-ratio during hemodialysis. Course of plasma C3d/C3 ratio in patients that developed a cardiovascular event (CV-event) during follow-up and in those that remained CV-event free (no CV-event). The data is presented as mean ± SEM and C3d/C3-ratio was calculated by dividing the C3d values (μg/mL) by the C3 levels (in mg/mL). The C3d/C3-ratio was determined at the start of hemodialysis session and 30, 60, 180 and 240 min after. Differences between the two groups were assessed by the student t-test and a one-way ANOVA followed by Bonferroni's post-hoc comparisons tests was used to compare C3d/C3 ratios at different time points within one group (**P < 0.01). The hashtag above the bars denotes a significant difference between the two groups (#P < 0.05), whereas the asterisk above the bars denotes a significant difference compared to baseline within the group. The number of subject is 17 in the “CV-event group” and 38 in the “No CV-event group”.

