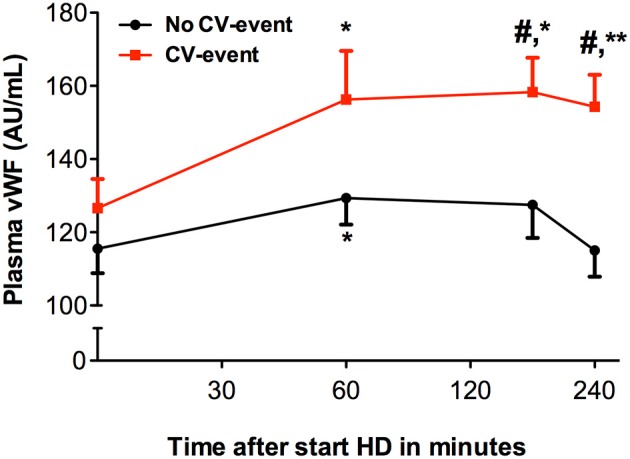
Figure 3.

Levels of von Willebrand factor during hemodialysis. Course of von Willebrand factor (vWF) in patients that developed a cardiovascular event (CV-event) during follow-up and in those that remained CV-event free (no CV-event). The data is presented as mean ± SEM. vWF was determined at the start of hemodialysis session and 60, 180 and 240 min after the start of the session. Differences between the two groups were assessed by the student t-test and a one-way ANOVA followed by Bonferroni's post-hoc comparisons tests was used to compare levels at different time points within one group (*P < 0.05, **P < 0.01). The hashtag above the bars denotes a significant difference between the two groups (#P < 0.05), whereas the asterisk above the bars denotes a significant difference compared to baseline within the group. The number of subject is 17 in the “CV-event group” and 38 in the “No CV-event group”.
