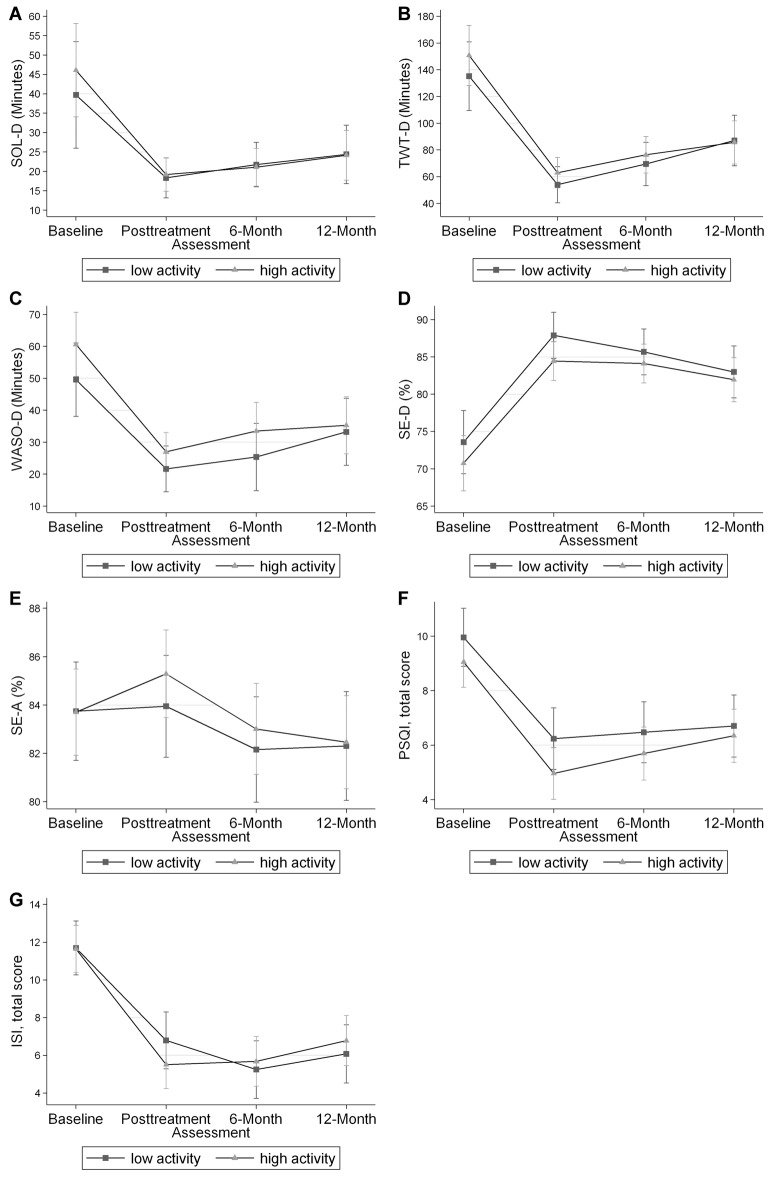
Figure 1.
Mixed effects-models mean and 95% confidence interval for each sleep outcome at each time point. No differences were found for any of the sleep outcomes at each time point. Panel (A) shows the data for diary sleep onset latency (SOL-D) in minutes. Panel (B) shows the data for diary total wake time (TWT-D) in minutes. Panel (C) shows the data for diary wake after sleep onset (WASO-D) in minutes. Panel (D) shows the data for diary sleep efficiency (SE-D) in percent. Panel (E) shows the data for actigraphy sleep efficiency (SE-A) in percent. Panel (F) shows the data for the Pittsburgh Sleep Quality Index (PSQI), total score. Panel (G) shows the data for the Insomnia Severity Index (ISI) total score.

