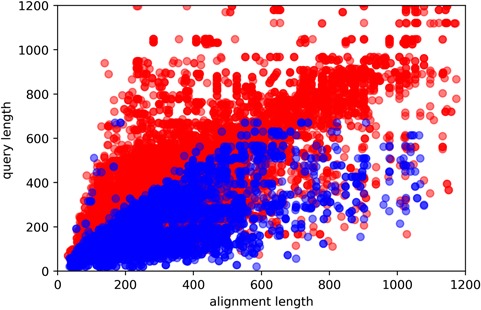
Figure 4.

Here, y-axis is the query sequence length, while the x-axis being the template sequence length. Red and blue colors indicate easy and hard targets, respectively. Plotted are all of the query sequences with best 60 template matches from all algorithms.
