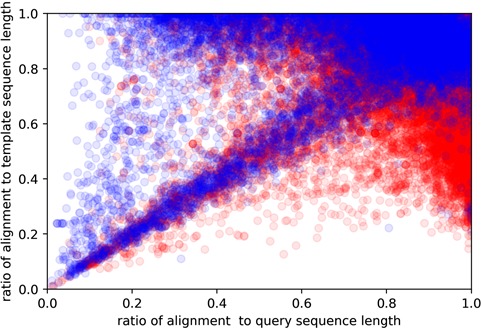
Figure 5.

Here, y-axis is the coverage for the template sequence (alignment length/template sequence length), while the x-axis being the coverage for query sequence (alignment length/query sequence length). Red and blue colors indicate easy and hard targets, respectively. Plotted are all of the query sequences with best 60 template matches from all algorithms.
