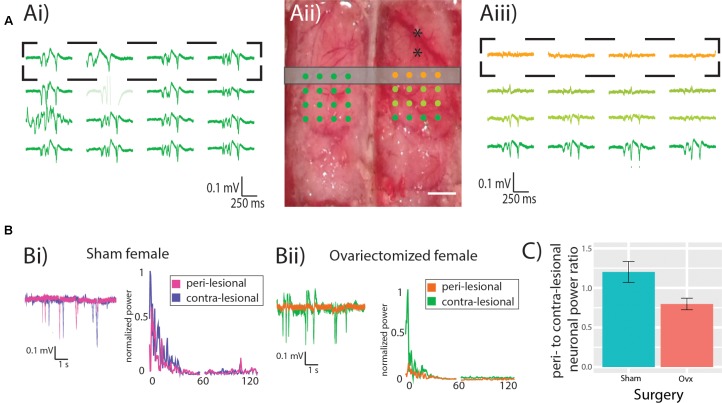
FIGURE 2.
Neuronal power. (A) Representative recording from contra- (Ai) and ipsi-lesional (Aiii) hemispheres, showing in orange the recordings from the peri-lesional tissue. Experimental design showing the MEA location (dots) in relation to the ET-1 injection sites (black asterisks) and the location of the CASL imaging slice (gray rectangle). Scale bar 0.5 mm. (B) representative recordings and power spectrum from the peri-lesional and contra-lesional hemisphere of Sham (Bi) and Ovx (Bii) animal. (C) Ovx animals (red bar) show a trend toward reduced neuronal power in the peri-lesional tissue when compared to that of Sham animals (green bar).

