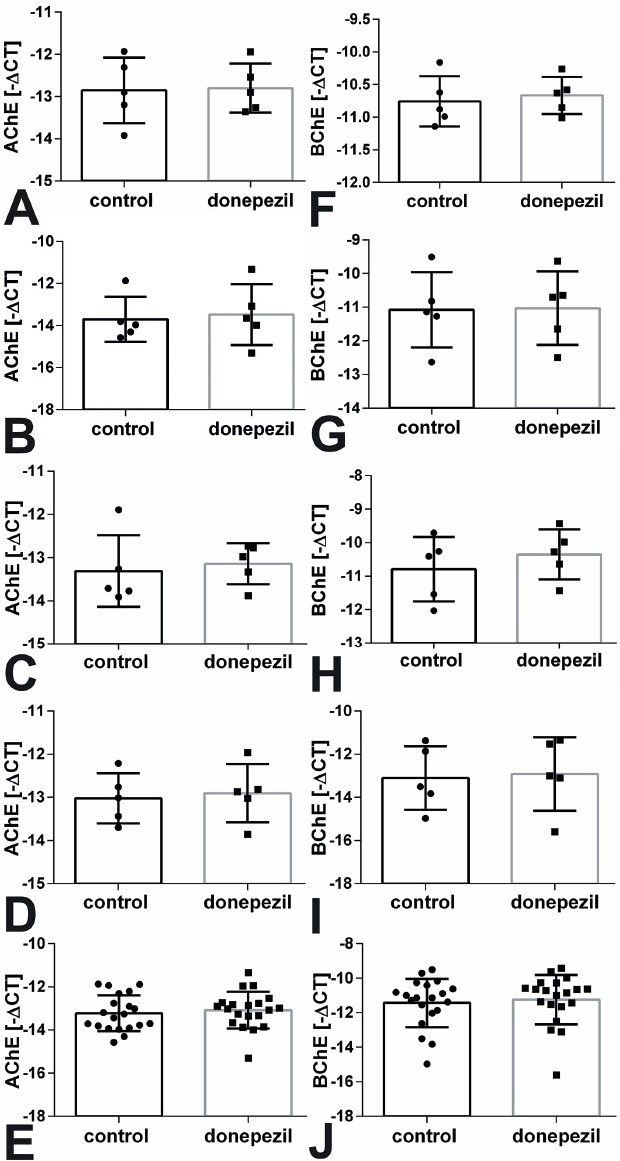
Figure 5.

AChE (A-E) and BChE (F-J) mRNA expression was not changed after treatment with donepezil compared to untreated MSC of (A, F) control, (B, G) OVX, (C, H) OD, and (D, I) ODS groups by real-time RT-PCR. (E, J) demonstrate the sum of all animals. CT: cycle threshold.
