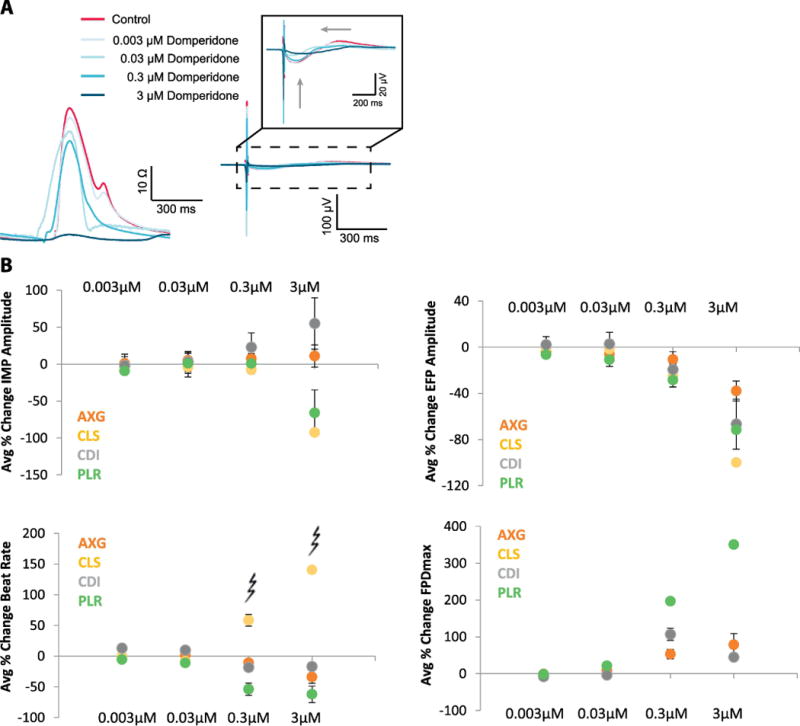
Figure 5. Domperidone demonstrates expected electrophysiological response.

A, Example raw mean beat impedance and field potential waveforms from CLS hiPSC-CMs (left) are presented before (red) and after dosing (shades of blue) with increasing concentrations of domperidone at 0.003, 0.03, 0.3 and 3 μM. B, Primary endpoints are quantified across replicates at one sites (n= 4 or 5 replicates). Error bars indicate +/− standard error across the replicates and arrhythmia is marked at 0.3, 3 μM.
