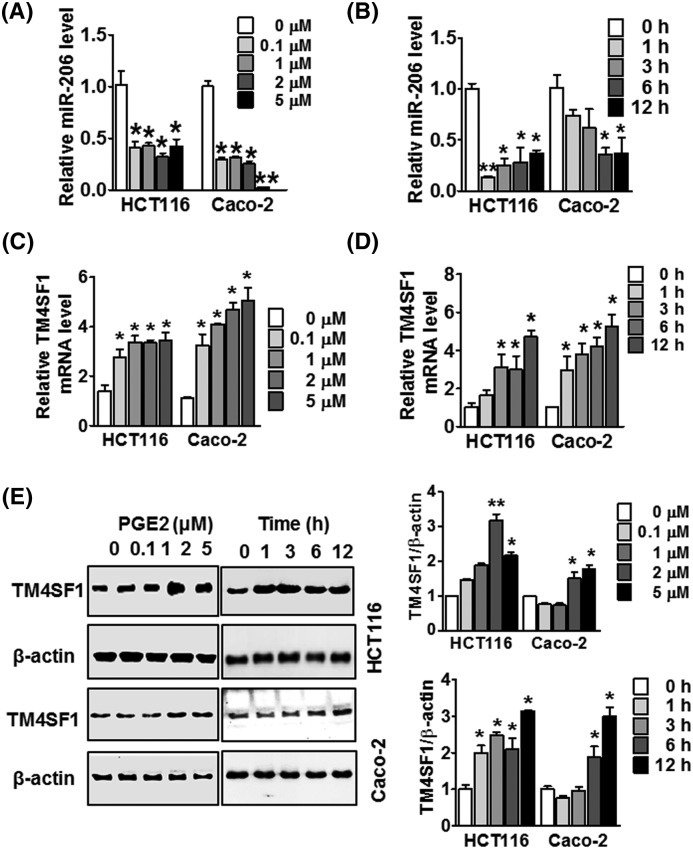
Figure 4. Effect of PGE2 at different concentrations and time points on miR-206 and TM4SF1 expression.
(A) HCT116 and Caco-2 cells were treated with the indicated concentrations of PGE2 (0, 0.1, 1, 2, and 5 μM, respectively) for 12 h, and miR-206 was detected by qRT-PCR. (B) miR-206 expression was detected by qRT-PCR, and HCT116 and Caco-2 cells were treated with PGE2 at a concentration of 1μM at the incubated time points. (C) HCT116 and Caco-2 cells were treated with the indicated concentrations of PGE2 (0, 0.1, 1, 2, and 5μM, respectively) for 12 h, and TM4SF1 expression was detected by qRT-PCR. (D) The expression of TM4SF1 was detected by qRT-PCR. HCT116 and Caco-2 cells were treated with PGE2 at a concentration of 1 μM at the indicated time points. (E) Expression of TM4SF1 protein was detected by Western blot analysis in HCT116 and Caco-2 cells in a time- and dose-dependent manner. *P<0.05 and **P<0.01 were compared with the control. The data are presented as mean ± standard error.

