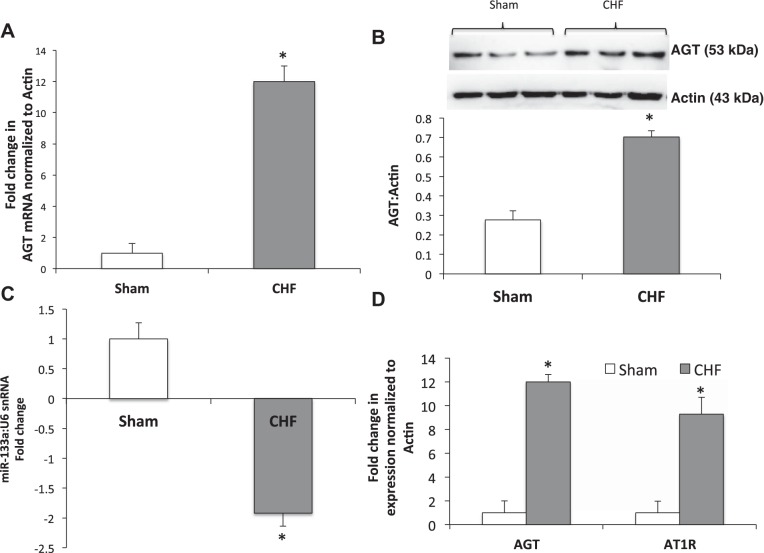
Fig. 3.
A: mRNA expression of AGT relative to actin in the paraventricular (PVN) measured by real-time PCR in sham and congestive heart failure (CHF) groups. B: representative Western blot and cumulative data of AGT expression in the PVN. C: miR-133a expression relative to U6 small nuclear (sn)RNA in the PVN. D: mRNA expression of AGT and AT1R relative to actin in the PVN measured by real-time PCR in sham and CHF groups. Values are means ± SE of analyses on 6−8 rats in each group. *P < 0.05 vs. sham.

