
Fig. 6.
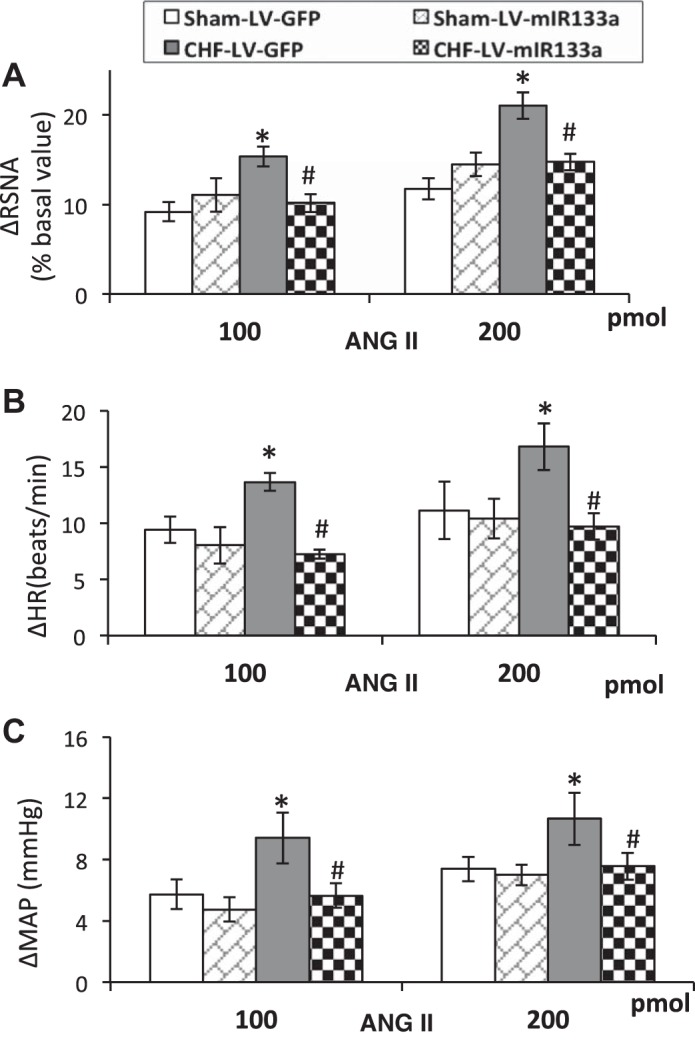
Mean changes in functional responses to microinjection of increasing doses of ANG II into the PVN in sham-LV-GFP, sham-LV-miR-133a, CHF-LV-GFP, and CHF-LV-miR-133a. A: RSNA. B: MAP (in mmHg). C: HR (in beats/min). For RSNA, values represent the percent change from baseline. The groups after ANG II microinjection are analyzed as separate groups. Values are means ± SE of 5−6 rats in each group. *P < 0.05 vs. sham-LV-GFP; #P < 0.05 vs. CHF-LV-GFP.