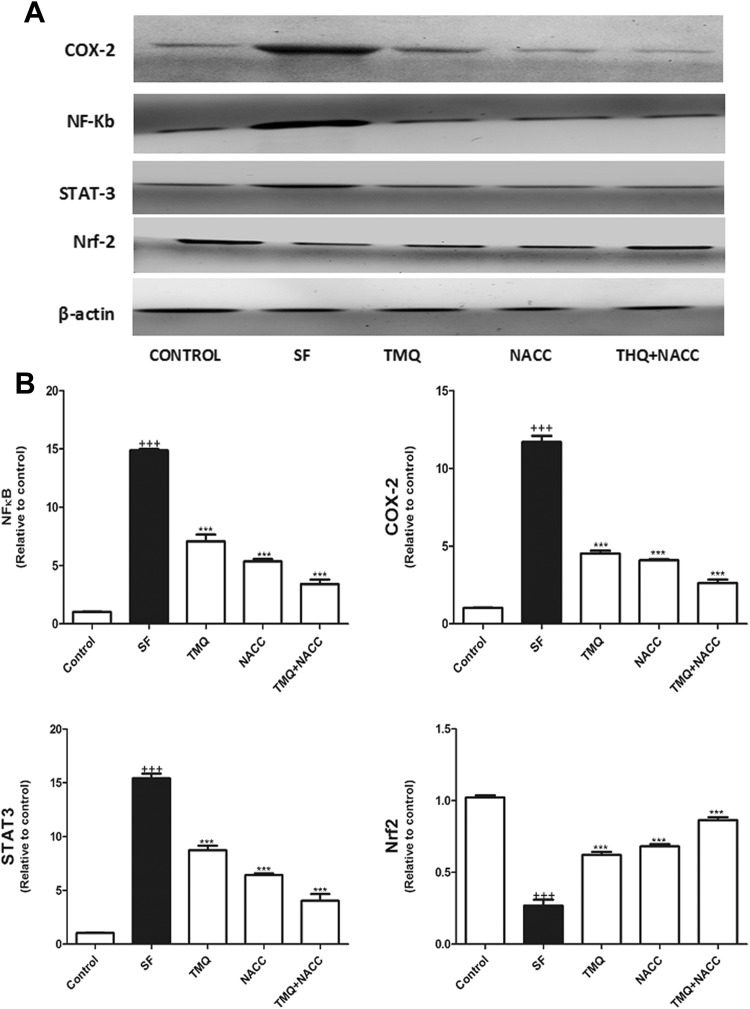
Figure 3.
A, Western blot analysis of the expression of NF-κB, COX-2, STAT3, and NrF2 proteins in control, SF-intoxicated, and all treated groups. B, The densitometry analysis of the expression of NF-κB, COX-2, STAT3, and NrF2 proteins in control, SF-intoxicated, and all treated groups. (Data corrected by β-actin and expressed as protein/β-actin). Data are presented as mean ± SEM (N = 6). +++ P ≤ .001 versus control and ***P ≤ .001 versus SF-intoxicated group. COX-2 indicates cyclooxygenase-2; NAC, N-acetylcysteine; NF-κB, nuclear factor-κB; NrF2, nuclear factor erythroid 2-related factor 2; SEM, standard error of the mean; SF, sodium fluoride; STAT-3, signal transducer and activator of transcription 3; TMQ, thymoquinone.

