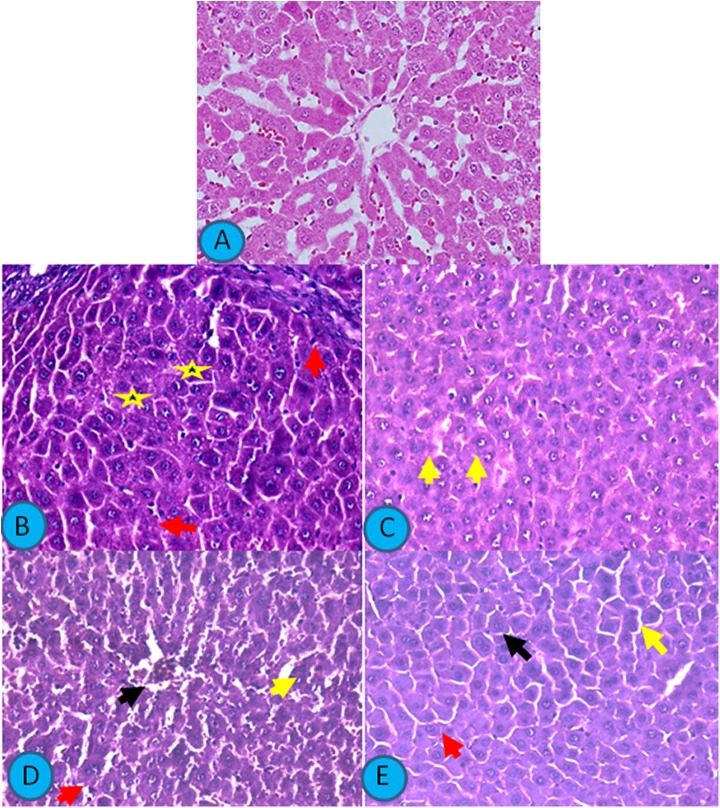
Figure 4.
Light photomicrographs of H&E-stained sections of the liver. Scale bar 400 µm. A, Liver from control rat showing normal hepatic architecture with normal hepatocytes and blood sinusoids. B, Liver from rat receiving SF showing focal areas of massive hepatic degeneration (yellow star) and many degenerated hepatocytes (red arrows). C, Liver from rat receiving thymoquinone showing mild improvement in the hepatic changes with many degenerated cells (yellow arrow). D, Liver from rat receiving N-acetylcysteine showing moderate improvement in hepatic cellular degeneration with many abnormal cells (arrows). E, Liver from rat receiving thymoquinone and N-acetylcysteine showing marked improvement in the hepatic cellular degeneration with apparently normal hepatic architecture with very few degenerated hepatocytes (arrows). H&E indicates hematoxylin and eosin; SF, sodium fluoride.

