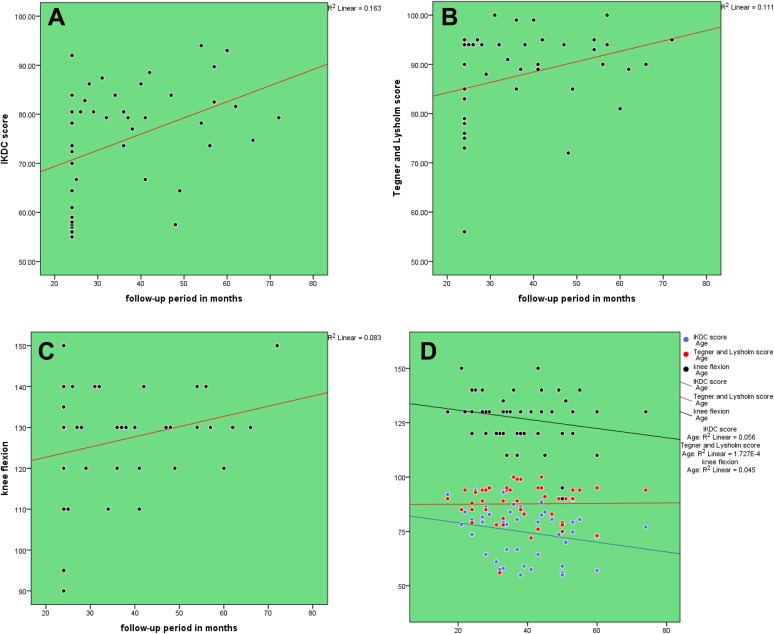
Figure 2.
(A) Scatter plot showing the relation between period of follow-up in months and International Knee Documentation Committee (IKDC) score. (B) Scatter plot showing the relation between period of follow-up in months and Lysholm score. (C) Scatter plot showing the relation between period of follow-up and postoperative knee flexion range of motion. (D) Scatter plot showing the relation between age and outcome measures: IKDC score, Lysholm score, and knee flexion range of motion.

