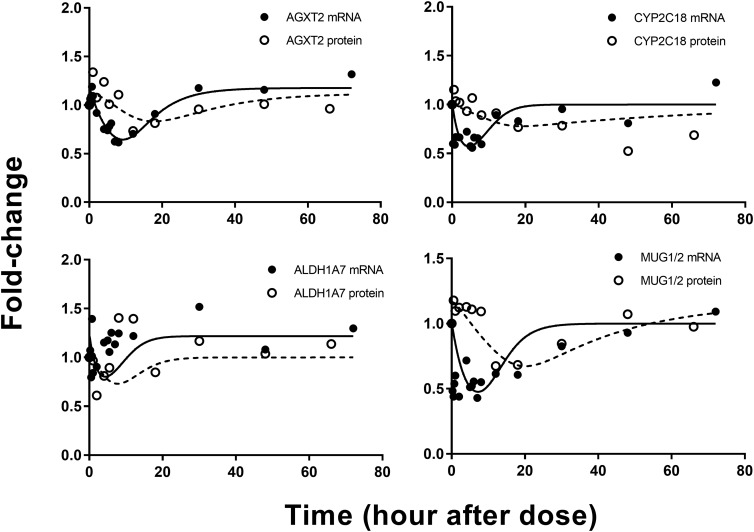
Fig. 6.
Representative fittings of genes described by model B. Solid circles are the mean gene array data, and the open circles depict the mean protein data. Solid lines are fittings for each mRNA and dashed line for each protein after MPL. Estimated parameter values for each mRNA and protein are listed in Table 2.

