. 2018 Aug 22;54(75):10554–10557. doi: 10.1039/c8cc03013h

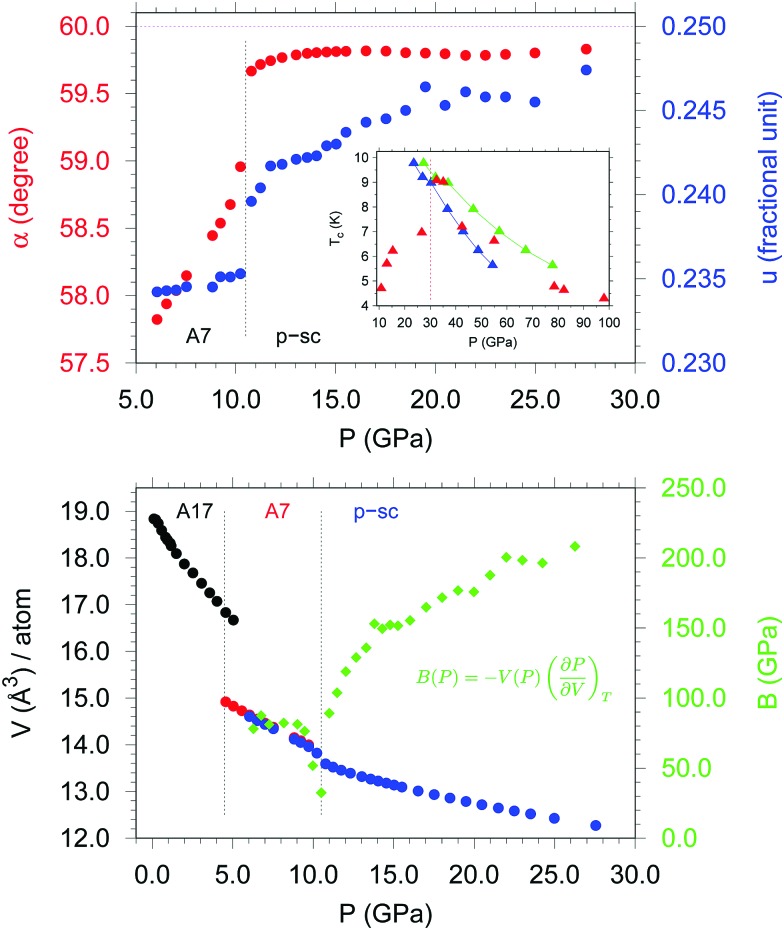
Fig. 3. Upper panel: Room T pressure evolution of the angle α (red) and atomic position u (blue) of the rhombohedral cell (R3[combining macron]m) in the A7 and p-sc structures of P, with the magenta dotted line indicating their limit values in the sc structure (respectively 60 and 0.250) and the black dotted line marking the formation of p-sc at 10.5 GPa. The inset, adapted from ref. 22, shows the anomalous pressure evolution of experimental Tc (red triangles),12 exhibiting a maximum at ∼30 GPa, in contrast to calculations assuming a sc structure (blue and green triangles),22 with the dotted line marking the room T pressure limit up to which p-sc has been instead demonstrated to exist.9 Lower panel: Room T pressure evolution of the atomic volume (left y axis) of P across the A17 (black), A7 (red and blue) and p-sc (blue) structures and of the bulk modulus (right y axis) across the A7 and p-sc structures (green). The blue solid circles refer to the data obtained by Rietveld refinement in the A7 and p-sc structures. The minimum in the pressure evolution of the bulk modulus at 10.5 GPa, corresponding to the onset of the A7 to p-sc transformation,9 highlights the characteristic anomalous behavior reported for first order structural phase transitions.20,21 .

Fig. 3