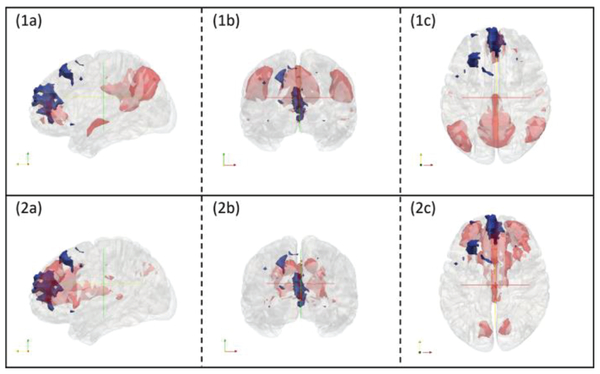
Fig. 12.
3D visualizations of input map 4 in figure 10 with RSN templates overlaid. Subfigure (1a), (1b) and (1c) are input maps (blue regions) with overlap-based classification of RSN template overlaid (red regions). They are displayed with cross sections along the x, y and z axes respectively. Subfigure (2a), (2b) and (2c) are input maps (blue regions) with RSN˙ overlaid (red regions). They are displayed with cross sections along the x, y and z axes respectively. Due to that the major activation regions reside in the prefrontal lobes, RSN˙ should be the category for this input map, but overlap-based method gave the wrong result.

