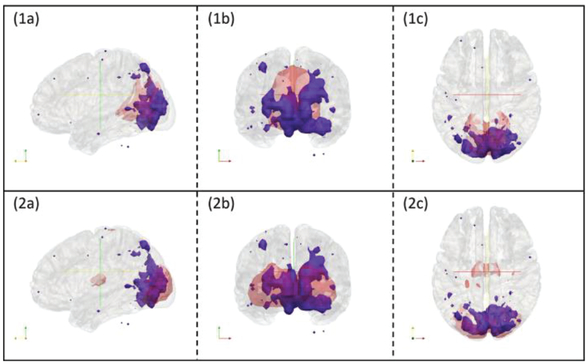
Fig. 9.
3D visualizations of input map 1 in figure 8 with RSN templates overlaid. Subfigure (1a), (1b) and (1c) are input maps (blue regions) with RSN1 overlaid (red regions). They are displayed with cross sections along the x, y and z axes respectively. Subfigure (2a), (2b) and (2c) are input maps (blue regions) with RSN2 overlaid (red regions). They are displayed with cross sections along the x, y and z axes respectively.

