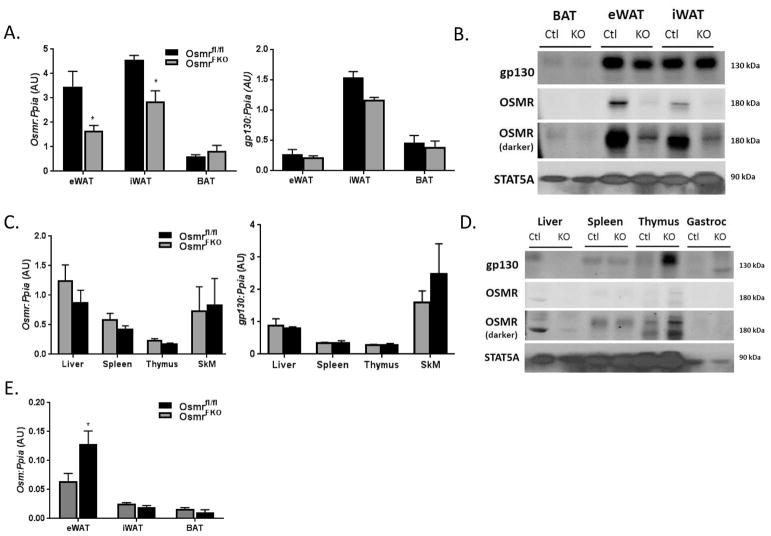
Figure 1. Expression levels of OSMR and gp130 are not altered in non-adipose tissues.
Tissue expression of OSMR and gp130 in various adipose depots at the A) gene and B) protein levels in OSMRfl/fl (CTL) and OSMRFKO (KO) chow-fed mice. Non-adipose tissue expression of OSMR and gp130 at the C) gene and D) protein levels was also measured. E) Gene expression of OSM itself was also measured in various adipose depots. Total RNA in various tissues was purified and analyzed by real-time PCR. Cyclophilin A (Ppia) was used as an endogenous control. Protein (100 ug for adipose tissues, 50 ug for all other tissues) was subjected to Western blot analysis. Data are shown as mean ± SEM. For PCR, n=8 per genotype (eWAT), n=3–4 per genotype (inguinal WAT (iWAT), brown adipose tissue (BAT), other tissues). ***p < 0.001, *p<0.05 vs. OSMRfl/fl. AU, arbitrary units.

