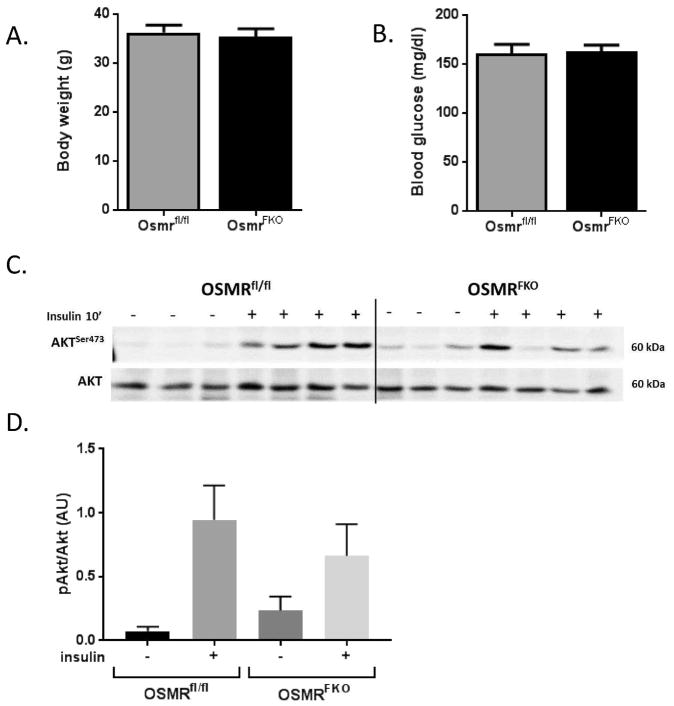
Figure 3. OSMRFKO mice exhibit a modest blunting of insulin-induced Akt phosphorylation.
A) Body weights, B) 4-hour fasting blood glucose, and C) protein expression levels of Akt, phosphoAkt, and phosphoERK in eWAT from chow-fed OSMRfl/fl and OSMRFKO (KO) mice. Body weights and blood glucose levels were not significantly different between genotypes. 100 ug protein was subjected to Western blot analysis. KO mice exhibited a slight diminution in Akt phosphorylation (S473) in eWAT. Densitometry analysis of D) pAkt/Akt ratio was conducted using Image Studio software. For vehicle injections, n=3 per genotype and for insulin injections, n=4 per genotype. Data are shown as mean ± SEM. AU, arbitrary units.

