Figure 1.

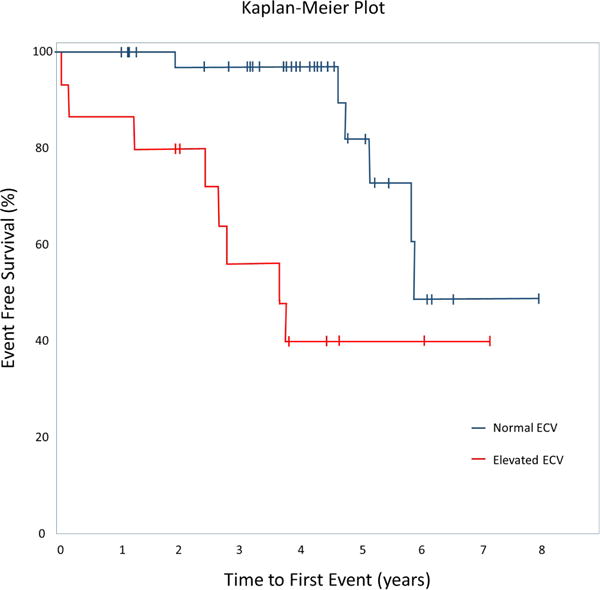
Kaplan-Meier Plot showing event-free survival curves for patients with a normal ECV vs. elevated ECV. Vertical bars indicate time of last follow up. P=0.001 log-rank statistic.

Kaplan-Meier Plot showing event-free survival curves for patients with a normal ECV vs. elevated ECV. Vertical bars indicate time of last follow up. P=0.001 log-rank statistic.