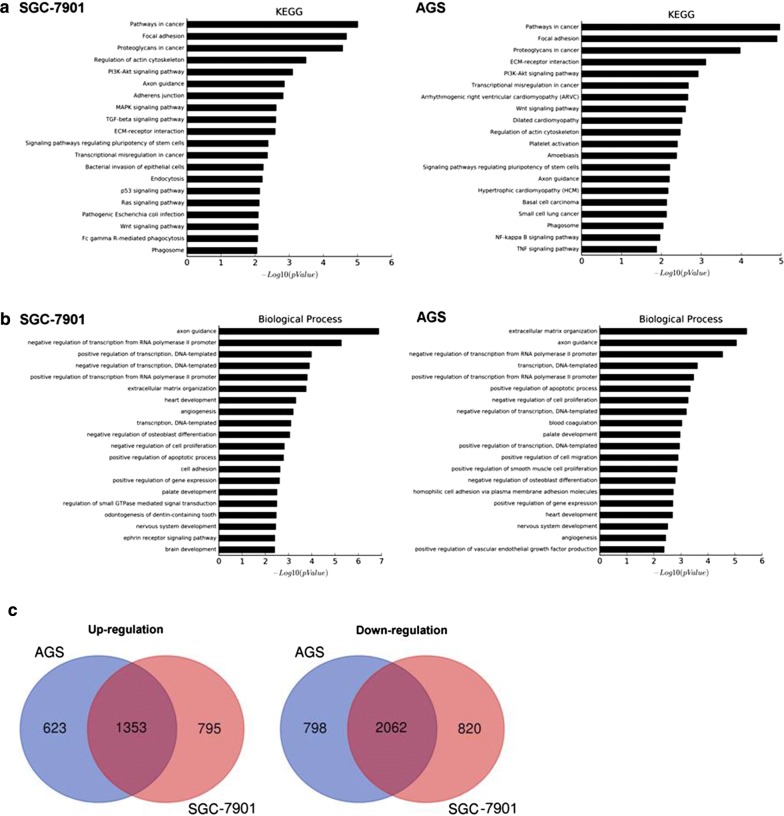
Fig. 6.
Microarray analysis of the differentially expressed gene profiles of RIG-I knockdown in gastric cancer cell lines. The Affymetrix GeneChip was used to investigate the differential gene expression profile of RIG-I knockdown in gastric cancer cell lines AGS and SGC-7901. a KEGG analysis showed top 20 signal pathways of differentially expressed gene profiles in SGC-7901 and AGS cell lines. b GO analysis showed top 20 biological process GO terms of differentially expressed gene profiles in SGC-7901 and AGS cell lines. c Venn diagram showed the overlap of differentially expressed genes in SGC-7901 and AGS cell lines (left, up-regulated genes; right, down-regulated genes)

