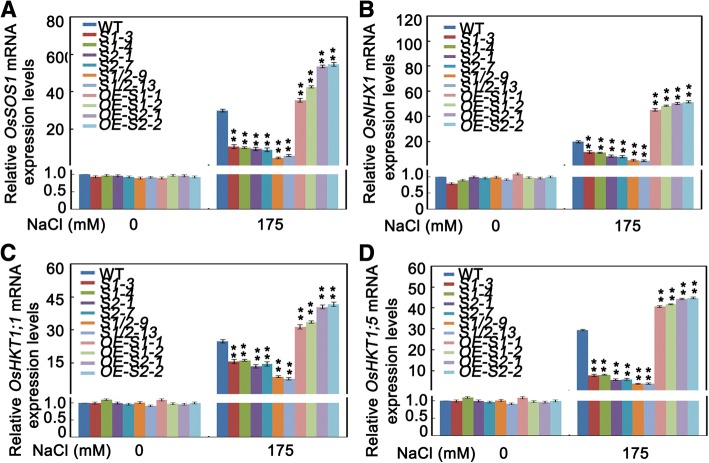
Fig. 10.
Expression of Na+ and K+ homeostasis genes. (a-d) Relative expression levels of OsSOS1, OsNHX1, OsHKT1;1 and OsHKT1;5 in the leaves of 4-week-old sapk1, sapk2 and sapk1/2 mutants; SAPK1-OE, SAPK2-OE plants and wild-type plants before and after salt stress. Values shown are means from three independent experiments. Error bars indicate the SD (n = 3). ** indicate statistically significant differences between mutant lines and wild type plants (P < 0.01)

