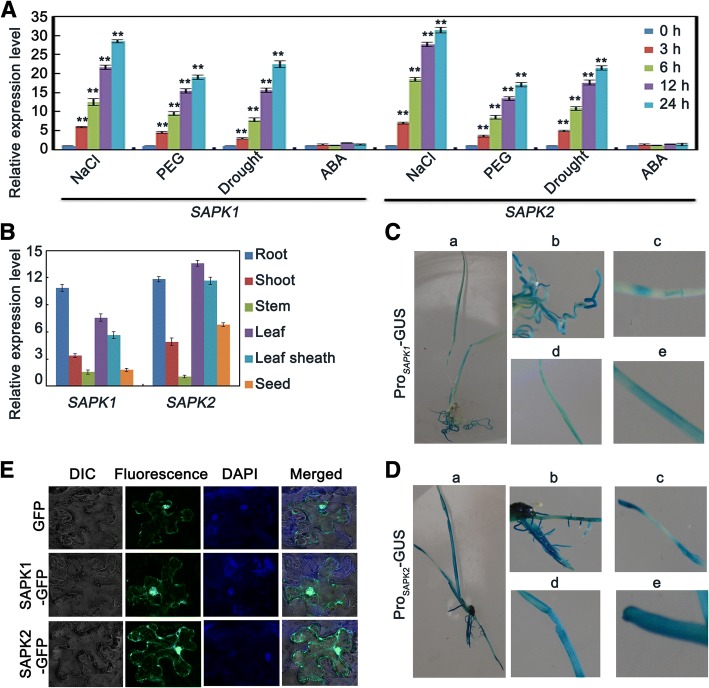
Fig. 2.
Analyses of SAPK1 and SAPK2 expression levels and locations. (a) Analysis of SAPK1 and SAPK2 expression levels under NaCl, PEG, drought and ABA treatments. The expression level was assessed by qRT-PCR. The expression level is indicated as a relative value, and expression at o hour was defined as 1.0. Error bars indicate the SD (n = 3). ** indicate statistically significant differences between 0 h and other times (P < 0.01). (b) qRT–PCR analysis of SAPK1 and SAPK2 expression in different tissues: root, shoot, stem, leaf, leaf sheath and seed. The expression level is indicated as a relative value, and expression in stem was defined as 1.0. Error bars indicate the SD (n = 3). (c) β–Glucuronidase gene (GUS) staining of ProSAPK1-GUS and (d) ProSAPK2-GUS transgenic plants in 2-week-old seedlings. Each panel shows whole plants (a) root (b) stem (c) leaf and (d) leaf sheath after GUS staining. (e) Subcellular localization of SAPK1 and SAPK2–green fluorescent protein (GFP) fusion proteins in protoplasts. Protoplasts from Nicotiana benthamiana leaves were transiently transfected and incubated 48 h

