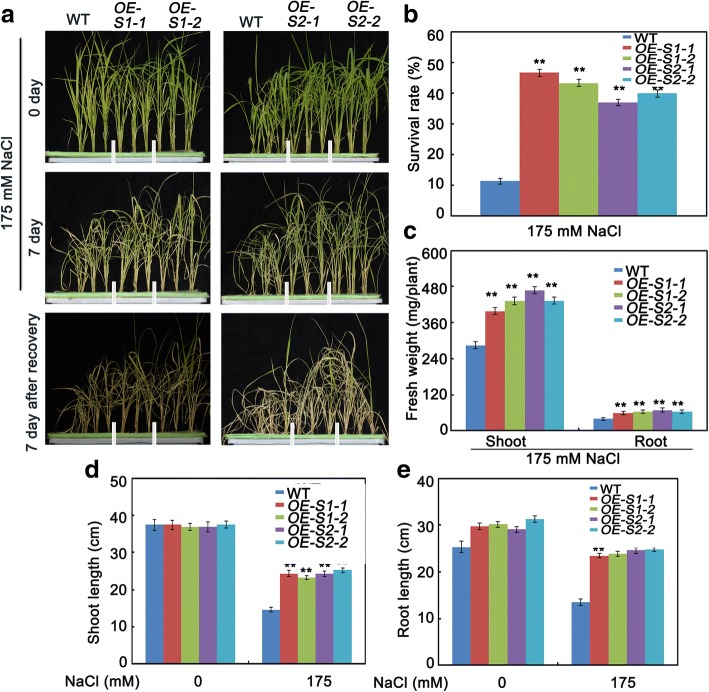
Fig. 7.
Salt stress tolerance assays of SAPK1-OE and SAPK2-OE plants. (a) Phenotype of SAPK1-OE, SAPK2-OE plants and wild-type plants before salt stress, after salt stress and re-watered for 7 days. Salt stress analysis was repeated three times. In each repeated experiment, at least 40 plants were used for each individual line. One representative picture was shown. (b) Survival rates corresponding to a. (c) Fresh weight analyses of SAPK1-OE, SAPK2-OE plants and wild-type plants under salt stress conditions. (d) Shoot and (e) Root elongation analyses corresponding to c. Error bars indicate the SD (n = 3). ** indicate statistically significant differences between overexpression lines and wild type plants (P < 0.01)

