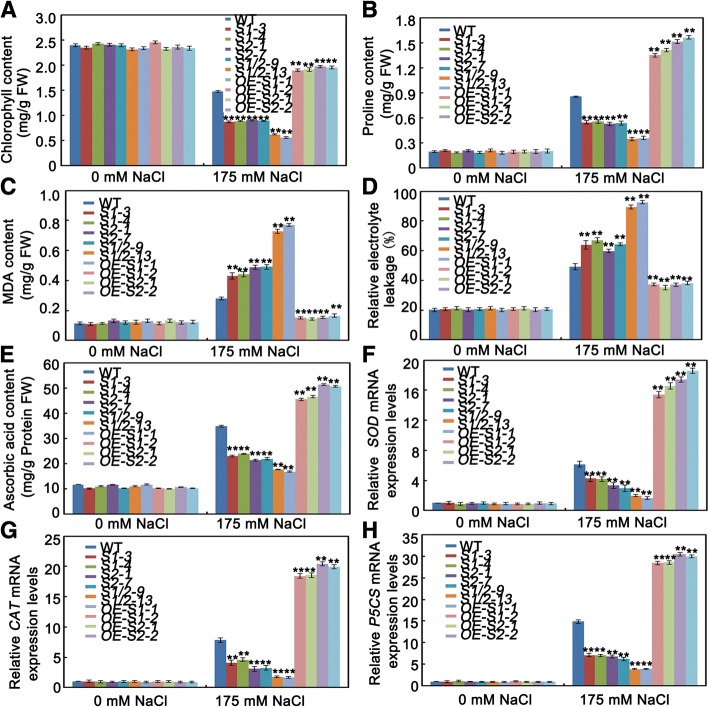
Fig. 8.
Analysis contents of chlorophyll, proline, MDA and ascorbic acid, relative electrolyte leakage and relative expression levels of SOD, CAT, P5CS. (a) Chlorophyll content (b) proline content (c) MDA content (d) relative electrolyte leakage (e) ascorbic acid content in leaf tissues sampled from sapk1, sapk2 and sapk1/2 mutants; SAPK1-OE, SAPK2-OE plants and wild-type plants before and after salt stress. (f) Transcript level of SOD (g) CAT and (h) P5CS in sapk1, sapk2 and sapk1/2 mutants; SAPK1-OE, SAPK2-OE plants and wild-type plants leaves before and after salt stress. Error bars indicate the SD (n = 3). ** indicate statistically significant differences between mutant lines and wild type plants (P < 0.01)

