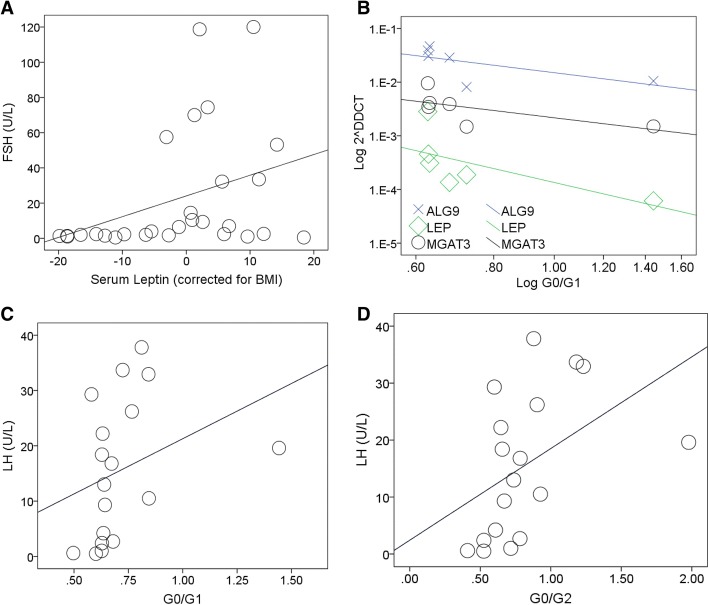
Fig. 1.
Hormones, G Ratio and gene correlations in galactosaemia. The strength of the association is denoted by rs (Spearman’s ρ), 1 being a perfect positive correlation, − 1 being a perfect negative correlation. The p-value (2-tailed) for the association is indicated. The sloping line is the best fit line and indicates the direction of the correlation. a FSH levels correlate positively with BMI corrected leptin in the CG combined group (n = 28: rs = 0.445, p < 0.05). b ALG9, LEP and MGAT3 expression correlate negatively with G-ratios (G0/G1) in CG females (ALG9: n = 18, rs = − 0.600, p < 0.01. MGAT3: n = 13, rs = − 0.687, p < 0.05. LEP: n = 6, rs = − 0.943, p < 0.01). c LH levels correlate positively with G-ratios (G0/G1) in CG females (n = 18, rs = 0.529, p < 0.05). d LH levels correlate positively with G-ratios (G0/G2) in CG females (n = 18, rs = 0.608, p < 0.01)

