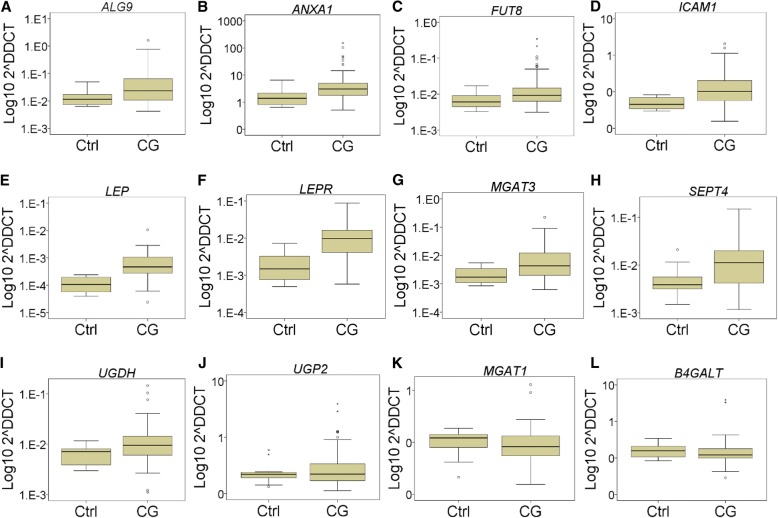
Fig. 3.
Boxplots of PBMC gene expression in CG combined group vs healthy controls (Ctrl). Each boxplot is titled with the relevant gene. The y-axis represents the 2-ΔCT value of gene expression (Applied Biosystems). The y-axis scale has been log transformed to the base 10 for clarity. Fold change (RQ) and 2ΔΔCT calculated with DataAssist (Applied Biosystems). Differences in expression between CG and Ctrl groups as calculated by The Mann Whitney U test, giving a p value which has been Benjamini-Hochberg False Discovery Rate (FDR) adjusted. Boxes indicate median (middle), 25th (bottom) and 75th (top) percentiles. Error bars indicate 1.5 times the interquartile range. Outliers are indicated with small circles or asterisks (extreme outliers). a ALG9 upregulated in CG vs Ctrl (n = 52 vs 16, RQ = 5.97, p < 0.005). b ANXA1 upregulated in CG vs Ctrl (n = 54 vs 16, RQ = 6.21, p < 0.01). (c) FUT8 upregulated in CG vs Ctrl (n = 50 vs 16, RQ = 4.13, p < 0.05). d ICAM1 upregulated in CG vs Ctrl (n = 53 vs 16, RQ = 4.79, p < 0.005). e LEP upregulated in CG vs Ctrl (n = 22 vs 10, RQ = 8.88, p < 0.005). f LEPR upregulated in CG vs Ctrl (n = 47 vs 16, RQ = 6.38, p < 0.0005). g MGAT3 upregulated in CG vs Ctrl (n = 47 vs 16, RQ = 6.10, p < 0.01). h SEPT4 upregulated in CG vs Ctrl (n = 52 vs 16, RQ = 3.62, p < 0.01). i UGDH upregulated in CG vs Ctrl (n = 46 vs 16, RQ = 2.66, p < 0.05). j UGP2 in CG vs Ctrl (n = 53 vs 16, not significant [NS]). k MGAT1 (n = 53 vs 16, NS). l B4GALT (n = 54 vs 16, NS)

