Fig. 2.
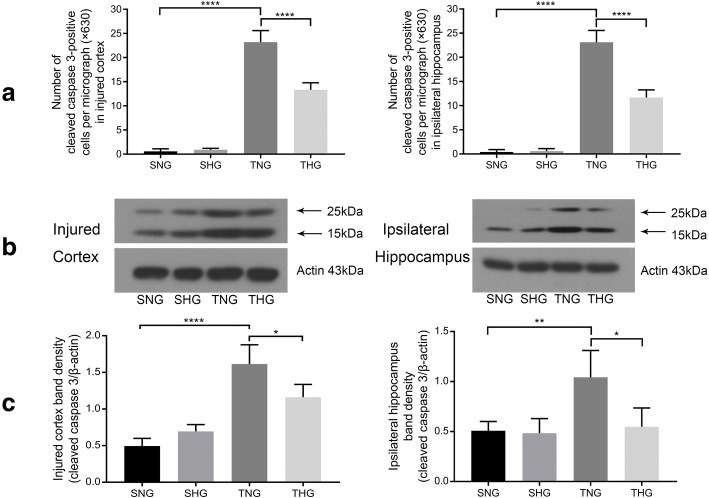
Immunofluorescence analysis and Western blotting of cleaved caspase 3 expression in the injured cortex and ipsilateral hippocampus. a Number of cleaved caspase 3-positive cells in the injured cortex and ipsilateral hippocampus. Data in the bar graphs represent mean ± SD. ****P < 0.001. At least 10 randomly selected microscopic fields were used for counting (magnification, × 630). b, c Western blotting of cleaved caspase 3 from the injured cortex and ipsilateral hippocampus. Data in the bar graphs represent mean ± SD. β-Actin was used as the load control. *P < 0.05; **P < 0.01; ****P < 0.001

