. 2018 Aug;38(4):279–285. doi: 10.14639/0392-100X-1950
Società Italiana di Otorinolaringologia e Chirurgia Cervico-Facciale, Rome, Italy
This is an Open Access article distributed under the terms of the Creative Commons Attribution Non-Commercial No Derivatives License, which permits for noncommercial use, distribution, and reproduction in any digital medium, provided the original work is properly cited and is not altered in any way. For details, please refer to http://creativecommons.org/licenses/by-nc-nd/3.0/
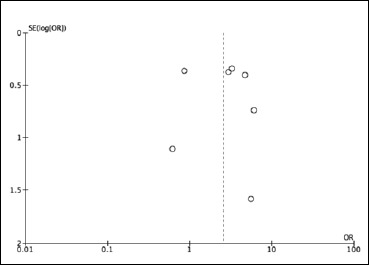
Fig. 5.

Funnel plot for the included trials.
