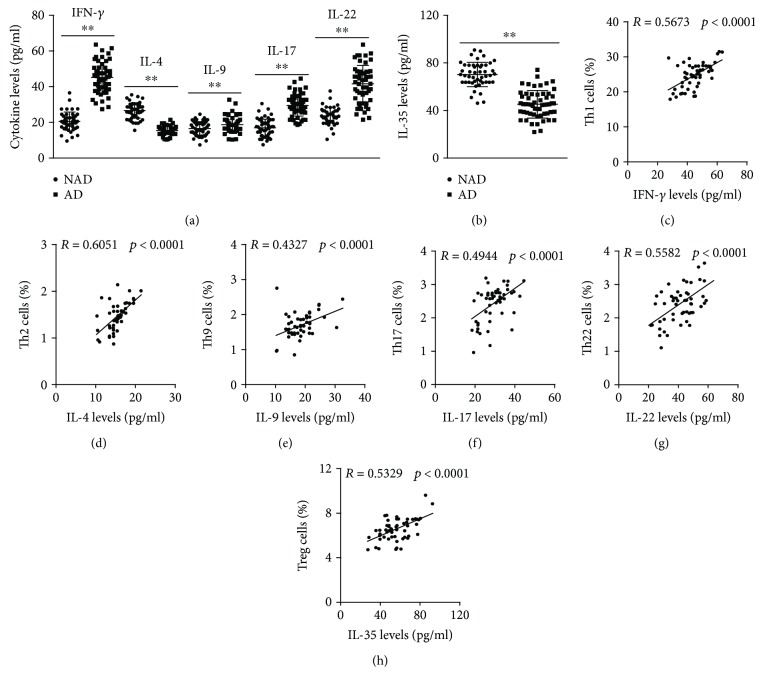
Figure 3.
Plasma cytokine levels in each group. (a-b) IFN-γ, IL-4, IL-9, IL-17, IL-22, and IL-35 levels in the NAD and AD groups. (c–h) The correlation of Th1 cells and IFN-γ, Th2 cells and IL-4, Th9 cells and IL-9, Th17 cells and IL-17, Th22 cells and IL-22, and Treg cells and IL-35 in AD patients. ∗∗p < 0.01 versus the NAD group.

