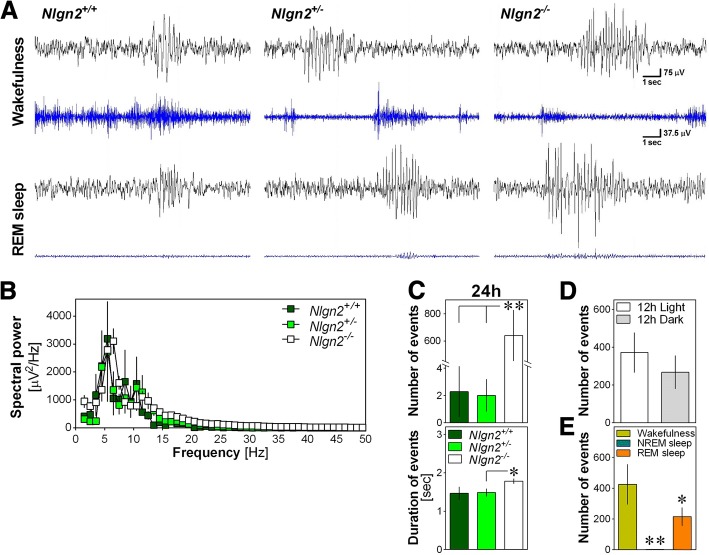
Fig. 3.
Abnormal EEG events in Nlgn2+/+, Nlgn2+/− and Nlgn2−/− mice. a) Representative 12-s EEG traces (black), and corresponding EMG traces (blue), showing abnormal EEG events for mice of the three genotypes during wakefulness (upper traces) and REM sleep (lower traces). Scale bars are the same for the two states of all mice. b) Absolute spectral power of events calculated between 1 and 50 Hz and averaged for each genotype for mice showing events (n = 3 Nlgn2+/+, n = 5 Nlgn2+/−, n = 12 Nlgn2−/−). c) Total number of events (upper panel) observed for the 24 h recording in the three genotypes, and their mean duration for mice showing events (lower panel). The number of events was significantly affected by genotype (F2,37 = 13.7, p < 0.0001). **: p < 0.01 between indicated points (planned comparisons). For mice showing events, the duration of events was significantly affected by genotype (F2,17 = 3.7, p < 0.05). *: p < 0.05 between indicated points (planned comparisons). d) Number of events calculated separately for the 12 h Light and the 12 h Dark periods in Nlgn2−/− mice only. The number of events did not significantly differ between the 12 h Light and the 12 h Dark periods (F1,11 = 3.5, p = 0.09). e) Number of events calculated separately for the three vigilance states in Nlgn2−/− mice only. The number of events was significantly different between vigilance states (F2,22 = 9.9, p < 0.001). **: p < 0.01 compared to the other two states; *: p < 0.05 compared to wakefulness

