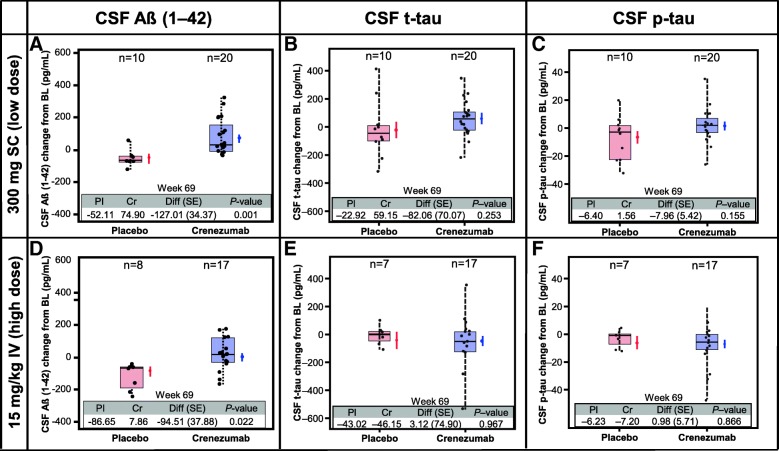
Fig. 3.
CSF biomarkers. Analysis of the change in biomarker levels found in CSF (Aβ(1–42) (a,d), t-tau (b,e), and p-tau (c,f)) in both the low-dose SC (a–c) and high-dose IV (d–f) cohorts. CSF t-tau and p-tau was not analyzed for one patient at week 69. BL baseline, Cr crenezumab, CSF cerebrospinal fluid, Diff difference, IV intravenous, Pl placebo, p-tau phosphorylated tau, SC subcutaneous, SE standard error

